


QS residue monitoring – overall evaluation
(evaluation period: 2009 to 2025)
A total of 203,253 fruit, vegetable, and potato samples were analysed between 2009 and 2025 for QS residue monitoring. The continuous development of methods for residue analysis over the last 20 years has contributed to a decline in residues in fruit and vegetables in recent years, with levels remaining consistently low: on average, the MRL exceedance rate for the last sixteen years is a low 0.6%. The overall low residue rates once again demonstrate that QS scheme participants are successfully mastering the challenges of plant protection. With their high level of sensitivity and sense of responsibility, they ensure that the growing quality and safety demands of trade and consumer are met.
Evaluation charts (2009 to 2025)
Development of the number of samples
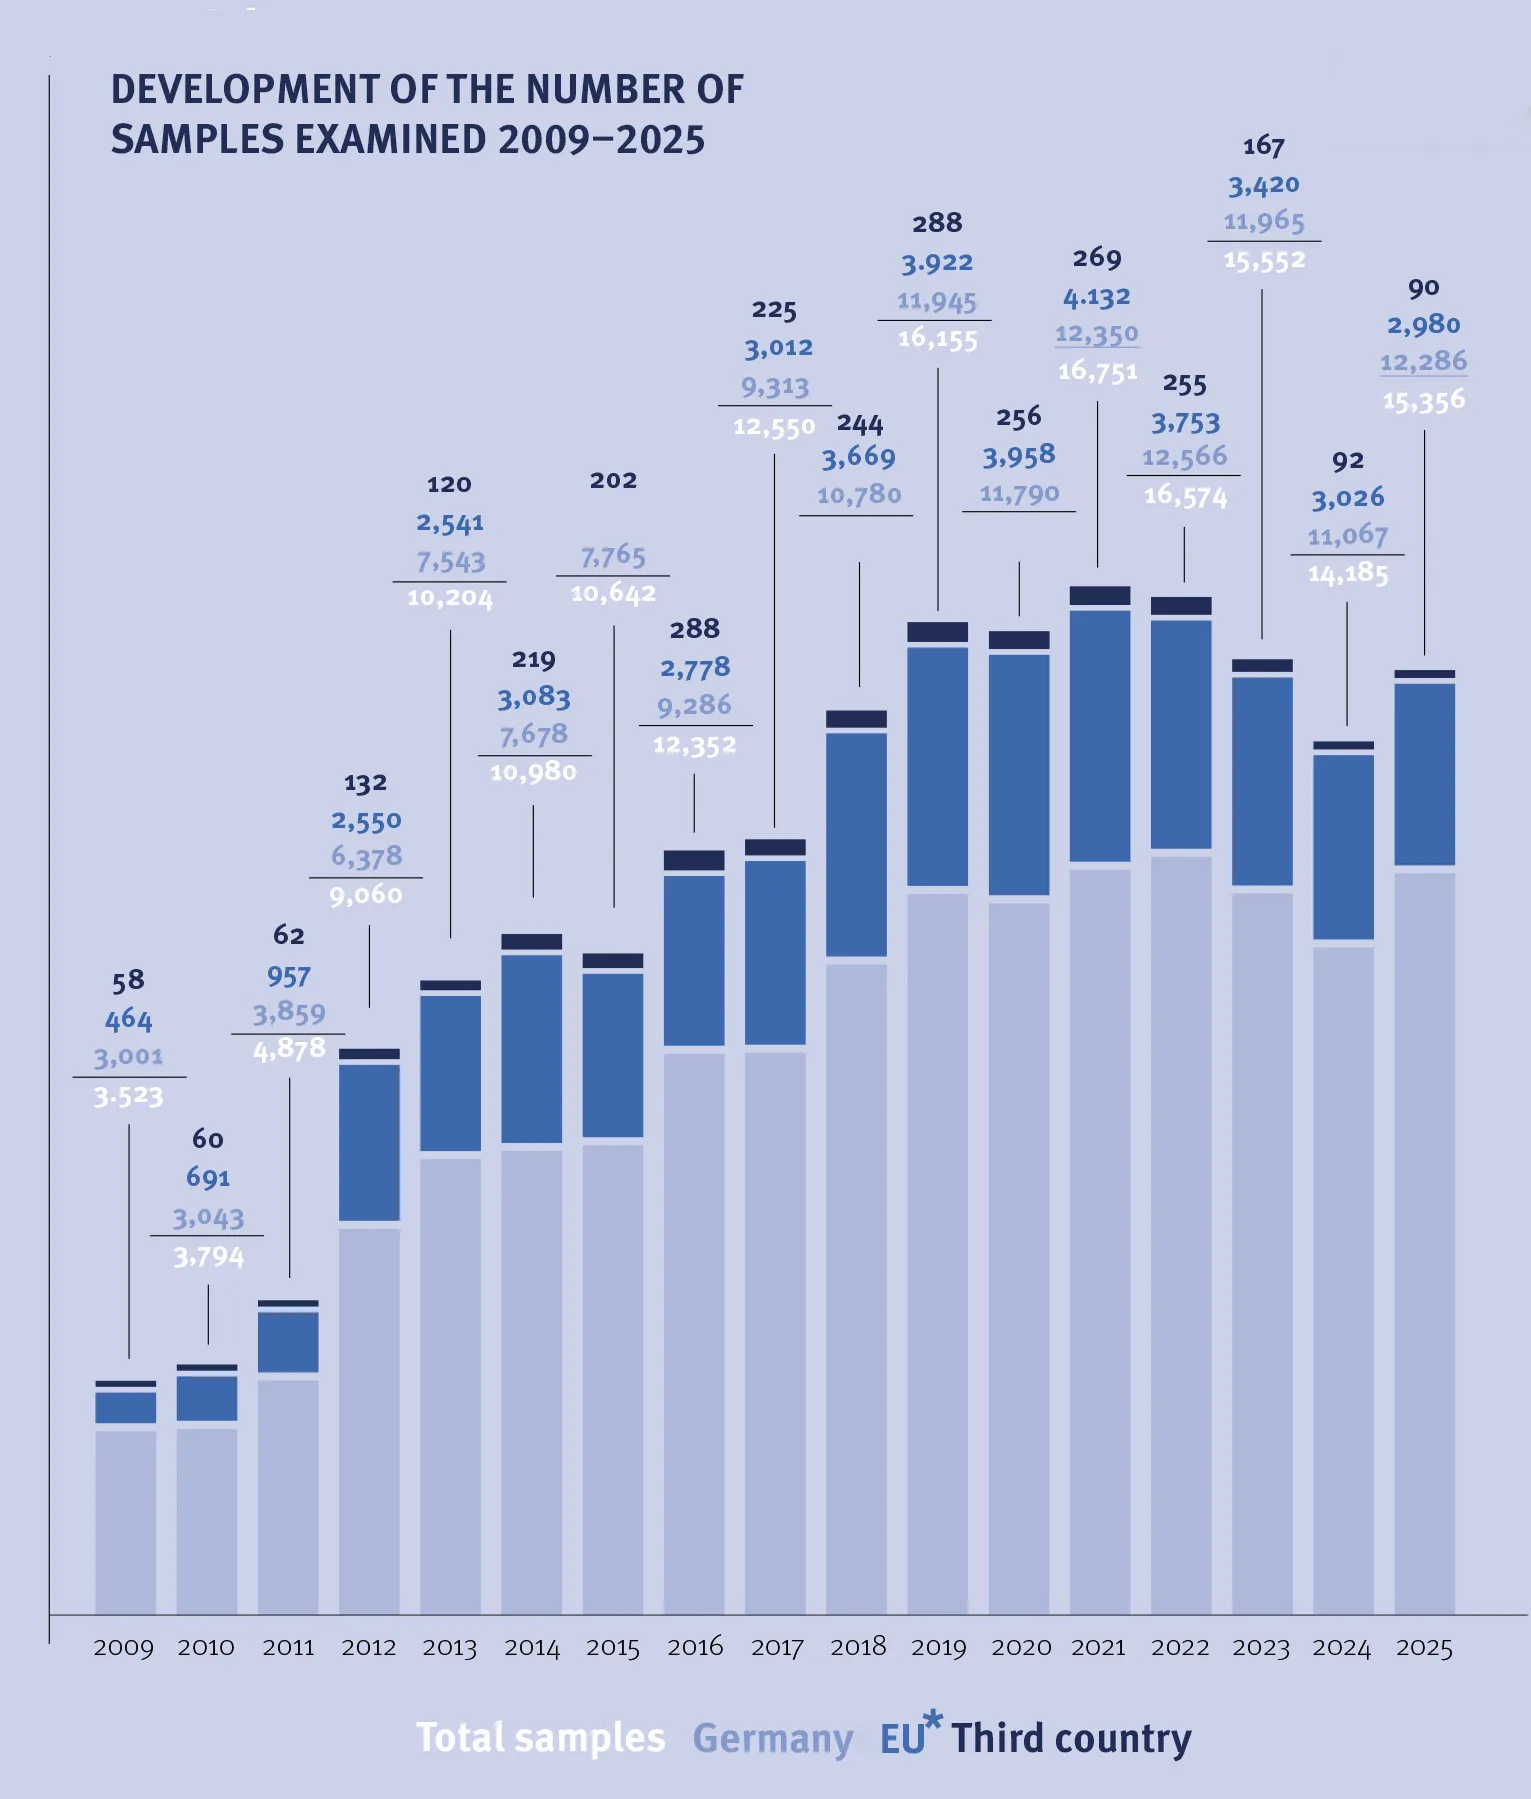
Between 2009 and 2025, the number of samples analysed for QS residue monitoring increased: in 2009, only 3,523 samples were analysed for pesticide residues, but in subsequent years the number of samples rose (maximum level in 2021: 16,751 samples, current evaluation for 2025: 15,356 samples)
Overall, the majority of samples analysed between 2009 and 2025 came from Germany (152,615 samples), followed by 47,611 samples from the EU and 3,027 samples from third countries outside the EU.
* Excl. DE (Click on the graphic to enlarge)
* Excl. DE (Click on the graphic to enlarge)
Development Proportion of samples exceeding the maximum residue limit
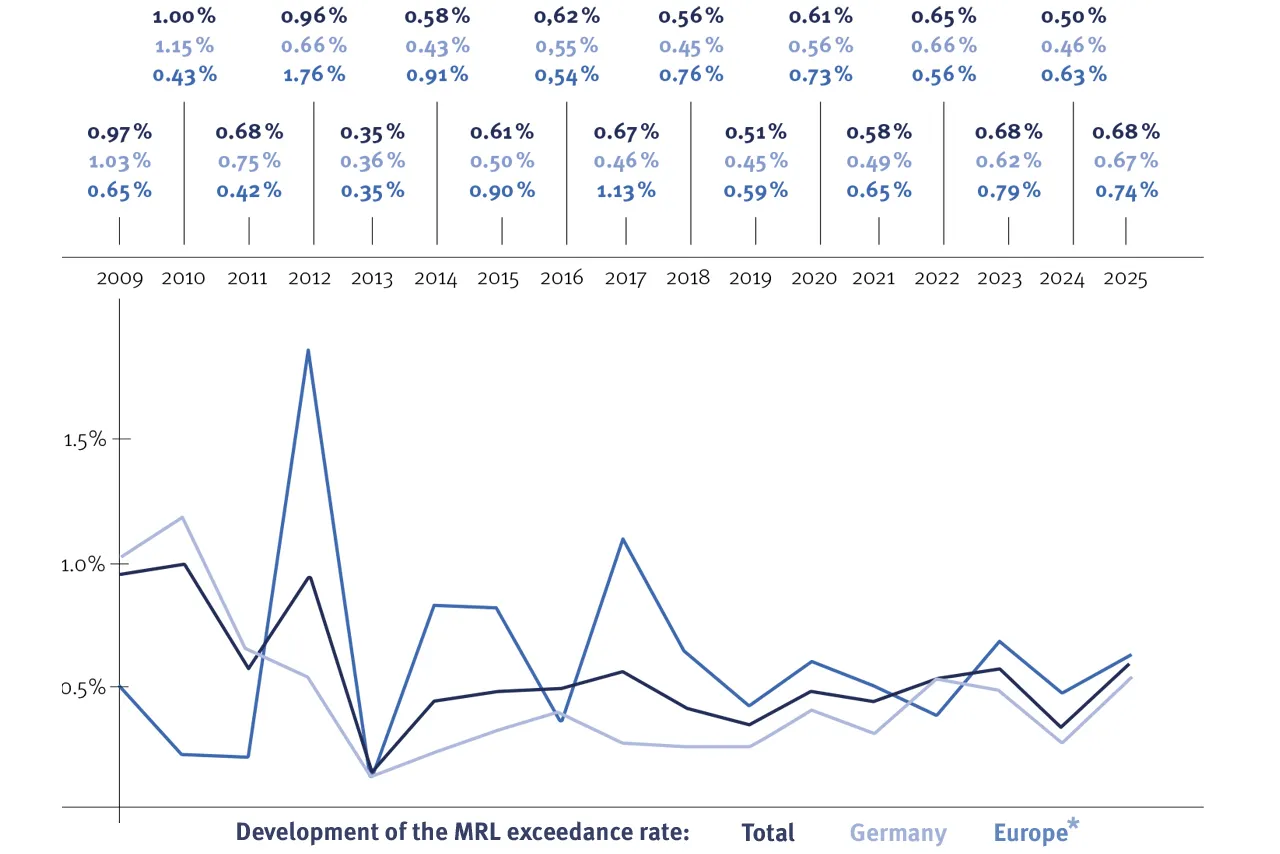
Over the years 2009 to 2025, the overall evaluation shows a positive trend in the MRL exceedance rate. Since 2018, the MRL rate has remained consistently low at less than 1 percent. The highest exceedance rate in an overall evaluation was 1.00 percent in 2010, and for products from the EU (excluding Germany) it was 1.76 percent in 2012. The lowest exceedance rate in an overall evaluation was 0.36 percent in 2013.
Development Proportion of samples with and without detection of active substance
Click on the graphic to enlarge
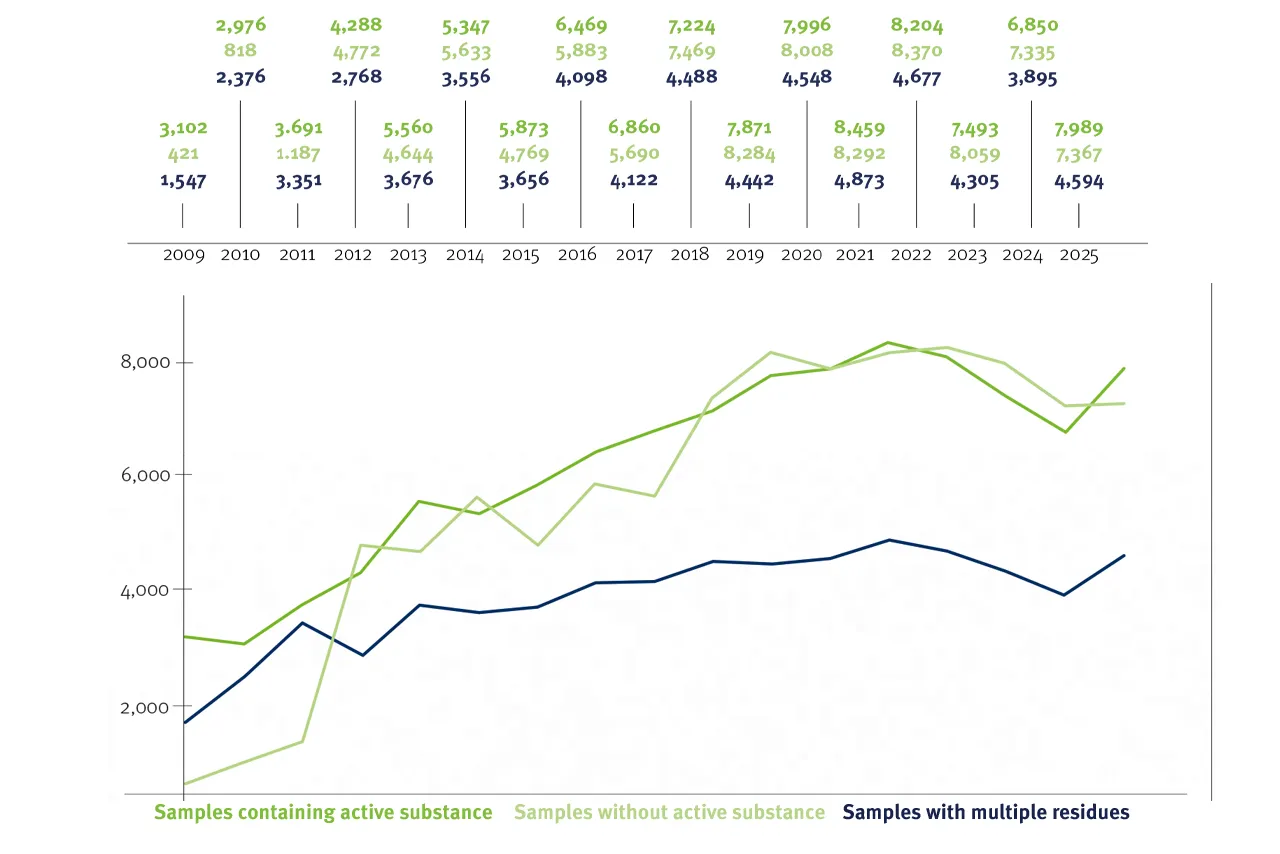
Between 2009 and 2025, the number of samples in which no active substance of the plant protection product was detected rose steadily. In relation to the increase in the total number of samples, the number of samples with multiple residues has remained constant and the number of samples with no residues or with only one residue of active substance has increased, which indicates an improvement in the quality of the goods.
QS residue monitoring – Current evaluation
(Evaluation period: October 1, 2024 to September 30, 2025)

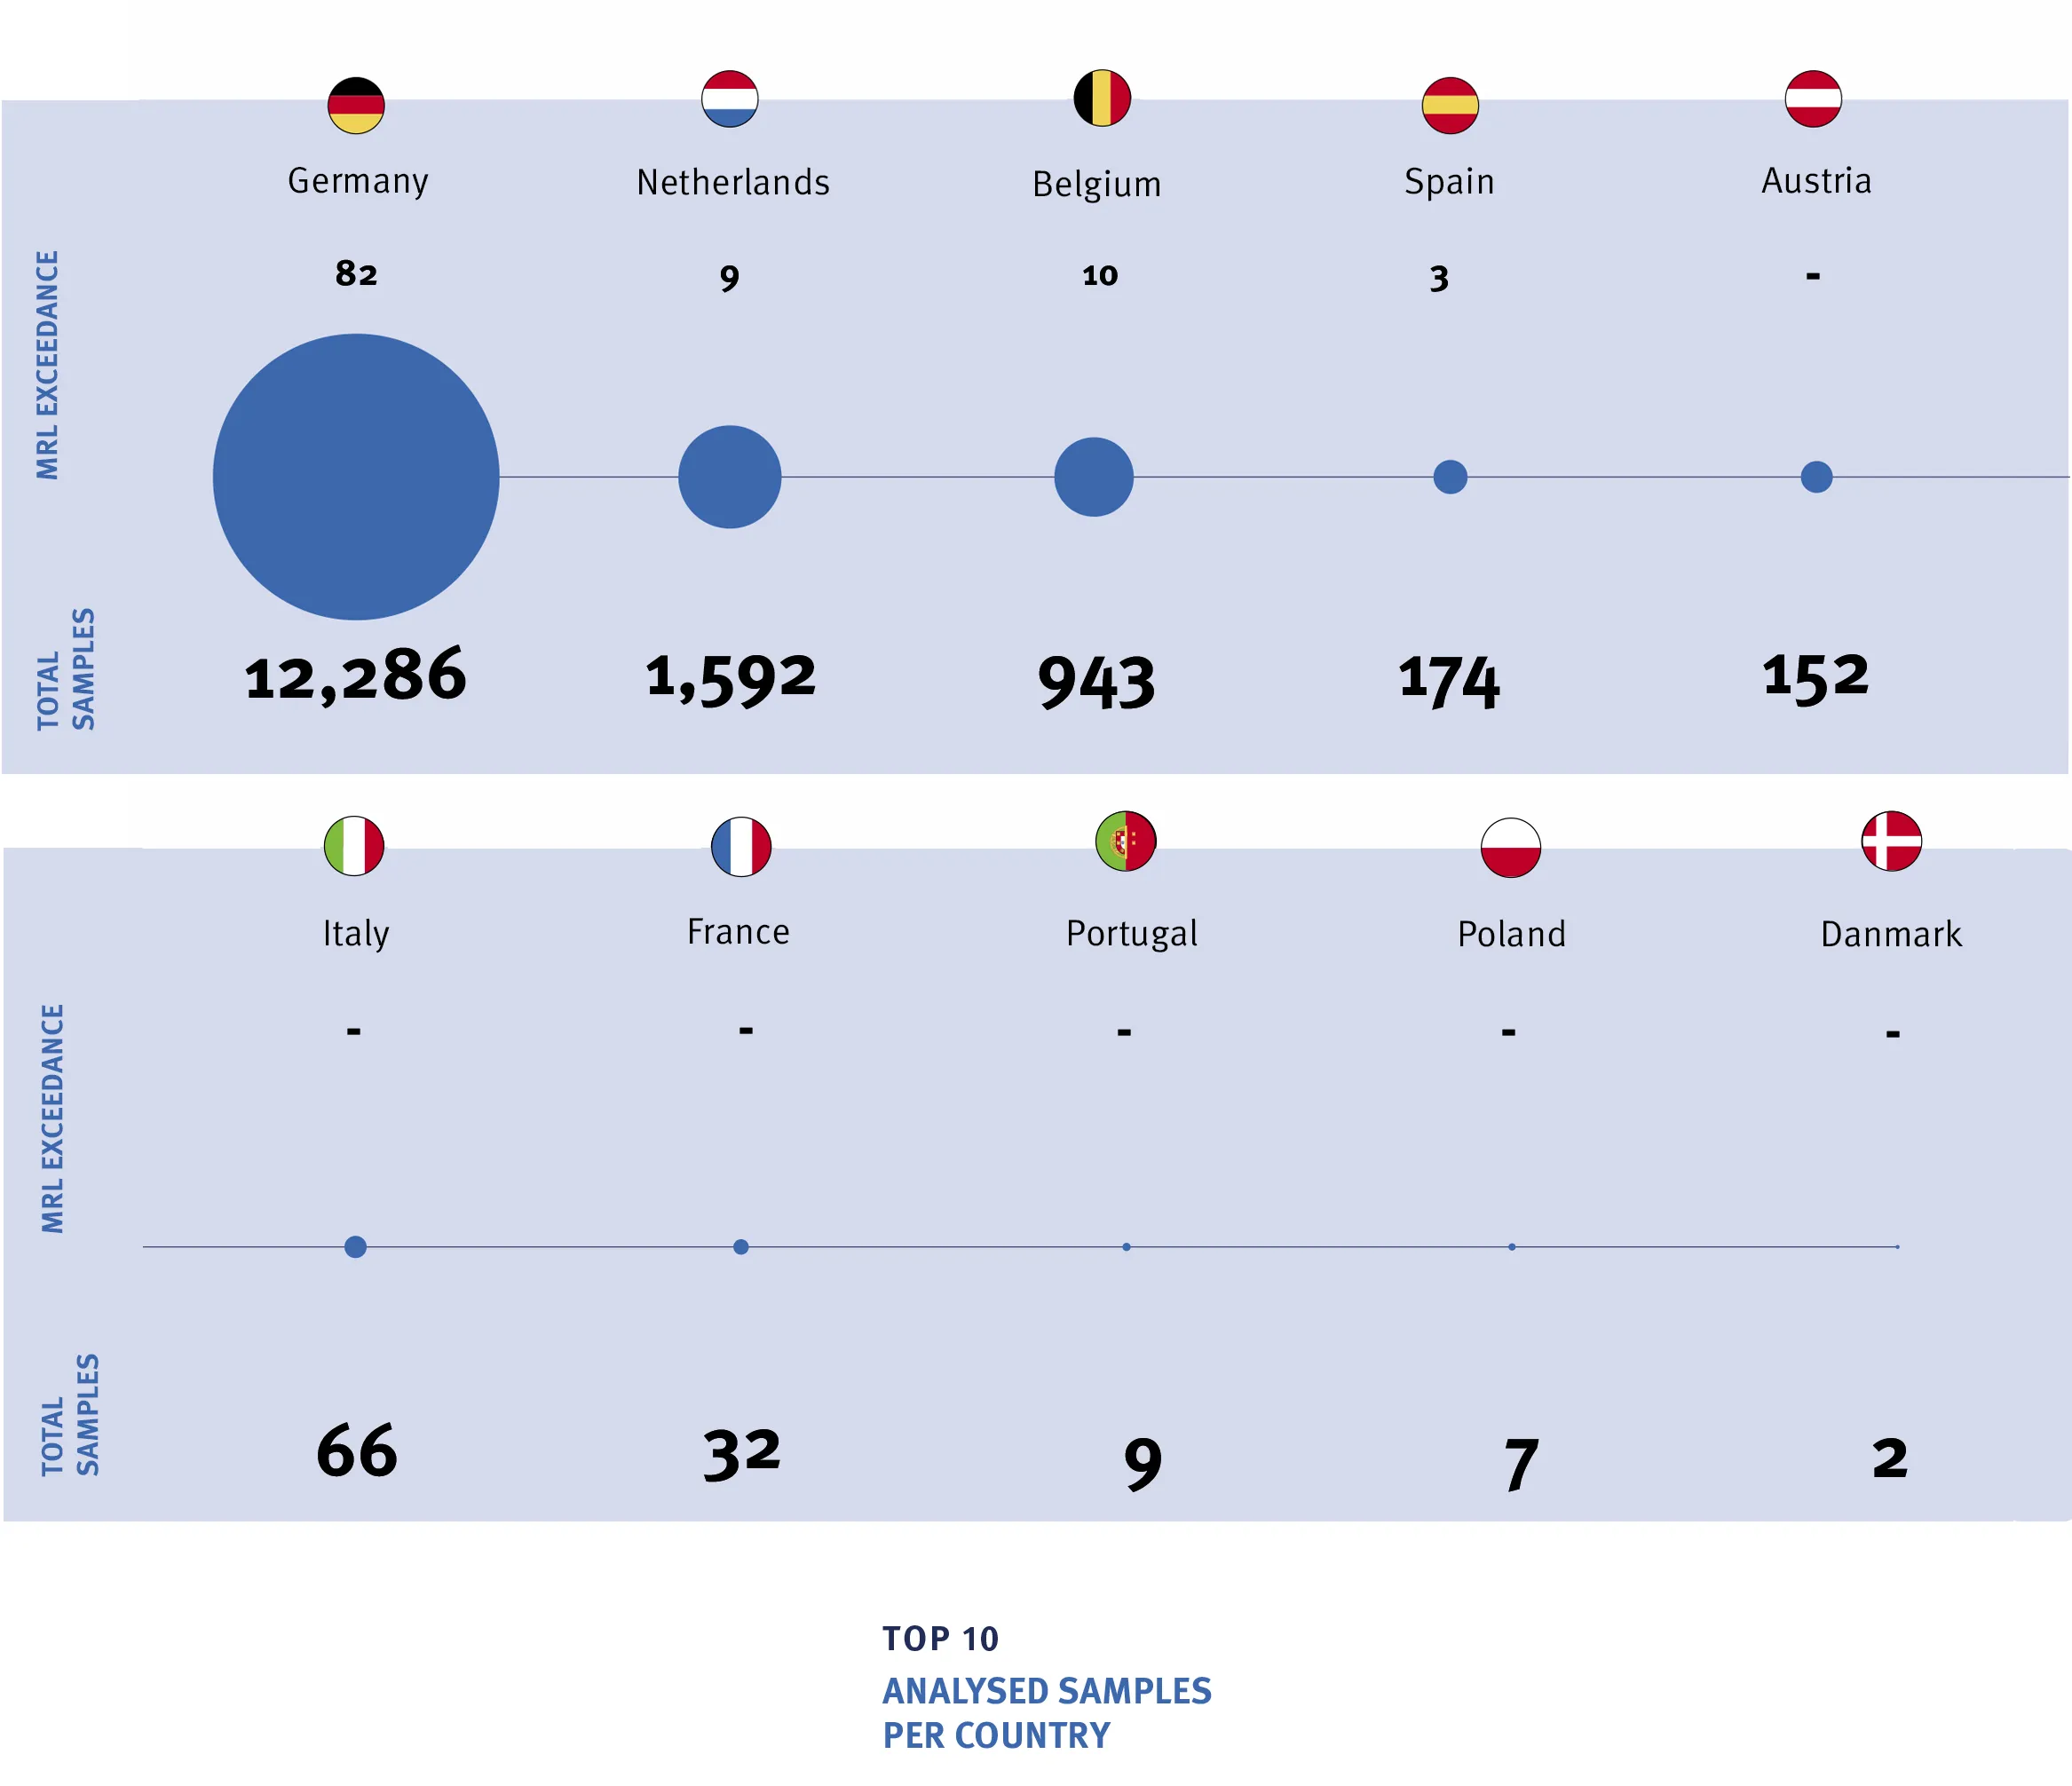
For residue monitoring, 15,356 fruit and vegetable samples were tested for pesticide residues during the evaluation period from October 1, 2024, to September 30, 2025. For the period from October 1, 2024, to September 30, 2025, 15,356 samples from 27 countries of origin were evaluated. The majority of the samples came from the EU, 12,286 of them from Germany. The legal limits were complied with in 99.36 percent of all samples. Only 104 samples exceeded the maximum residue levels. This means that the current exceedance rate is 0.68 percent, which is the same as last year's figure. This trend is evident both in German samples, where the exceedance rate rose from 0.44 to 0.67 percent, and in samples from the EU (excluding Germany), where the rate increased from 0.485 to 0.74 percent.
QS residue monitoring—an overview of all current results
-
- Evaluation period: October 1, 2024 to September 30, 2025
- Total number of samples evaluated: 15,356 (For comparison: 14,520 (2024) /15,580 (2023) / 17,047 (2022) / 16,725 (2021))
- Number of samples evaluated from Germany: 12,286
- Number of samples evaluated from the EU including Germany: 15,266
- Number of samples evaluated from third countries: 90
- Number of samples without MRL exceedances (total): 15,258 (For comparison: 14,518 (2024) / 15,767 (2023) / 16,932 (2022) / 16,642 (2021))
- Number of samples exceeding MRL (total)*: 104 (For comparison: 72 (2024) / 113 (2023), 115 (2022) / 83 (2021))
- Exceedance rate (total): 0.68% (For comparison: 0.495% (2024) / 0.71% (2023) / 0.67% (2022) / 0.48% (2021))
- Exceedance rate for products from Germany: 0.67% (For comparison: 0.44% (2024) / 0.66% (2023) / 0.64% (2022) / 0.45% (2021))
- Exceedance rate for products from Europe (including Germany): 0.74% (For comparison: 0.485% (2024) / 0.70% (2023) / 0.64% (2022) / 0.48% (2021))
- Number of sample countries: 27 (For comparison: 28 (2024) / 33 (2023) / 41 (2022) / 45 (2021))
* Based on the actual value (measured value without taking into account an expanded measurement uncertainty of ± 50 percent).
TOP 10 - Number of samples analysed (total) per country/samples exceeding MRL
Click on the graphic to enlarge
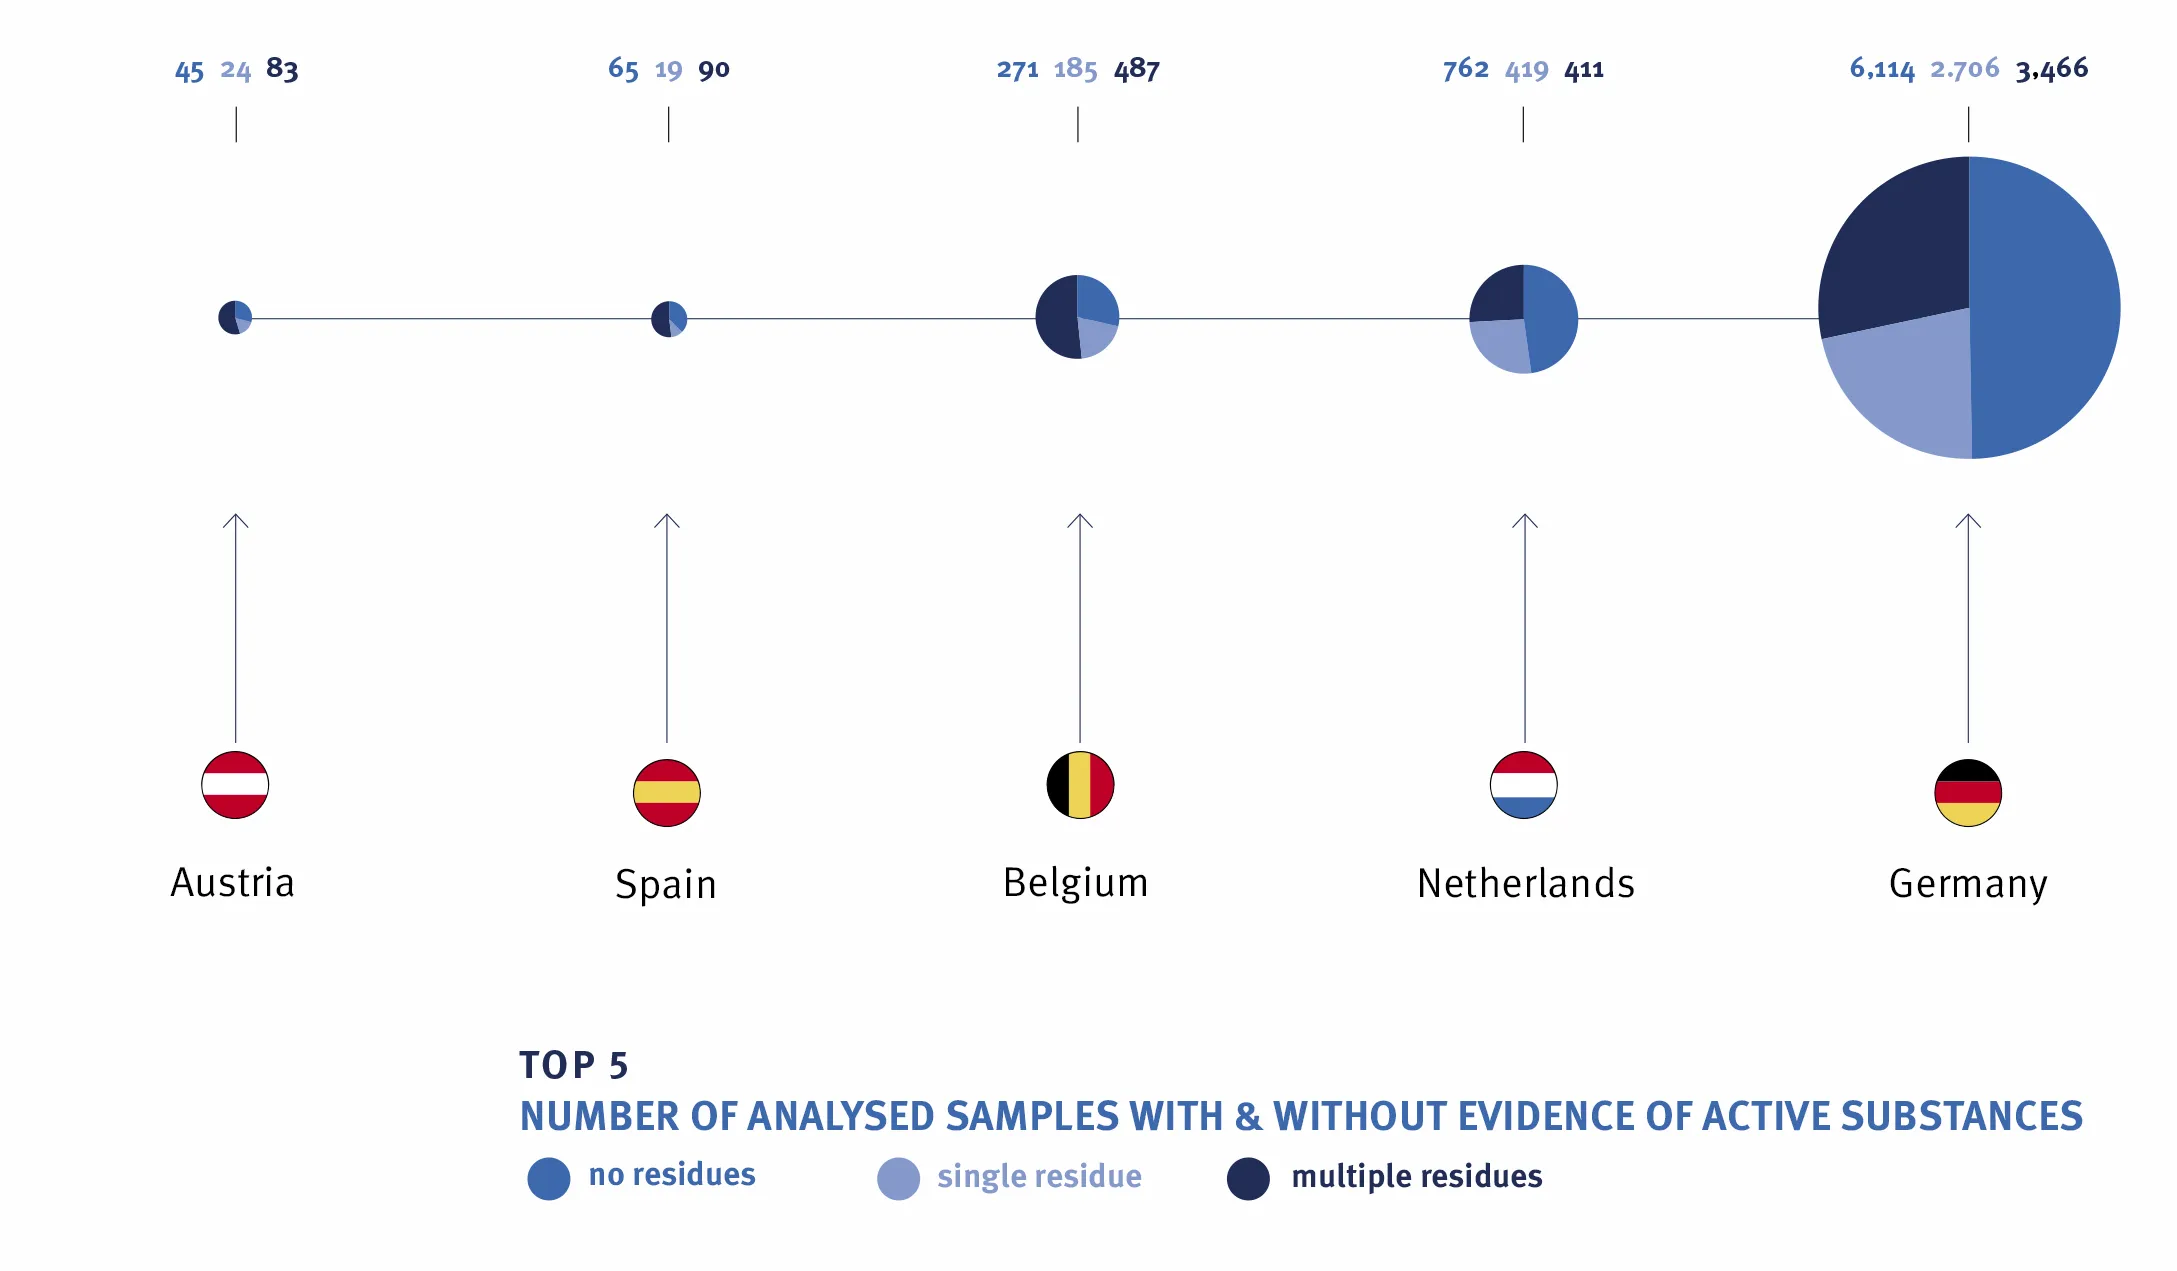
Number of samples analysed with and without detection of active substances (top 5 in Europe)
6,114 of a total of 12,286 fruit and vegetable samples from Germany analysed showed no residues of active substances from plant protection products. One plant protection product active substance was detected in 2,706 samples from Germany, while the remaining 3,466 samples contained residues of several active substances. The infographic shows the ratio of residue-free fruit and vegetable samples to samples with single and multiple residues in the Netherlands, Belgium, Spain, and Austria.
Click on the graphic to enlarge
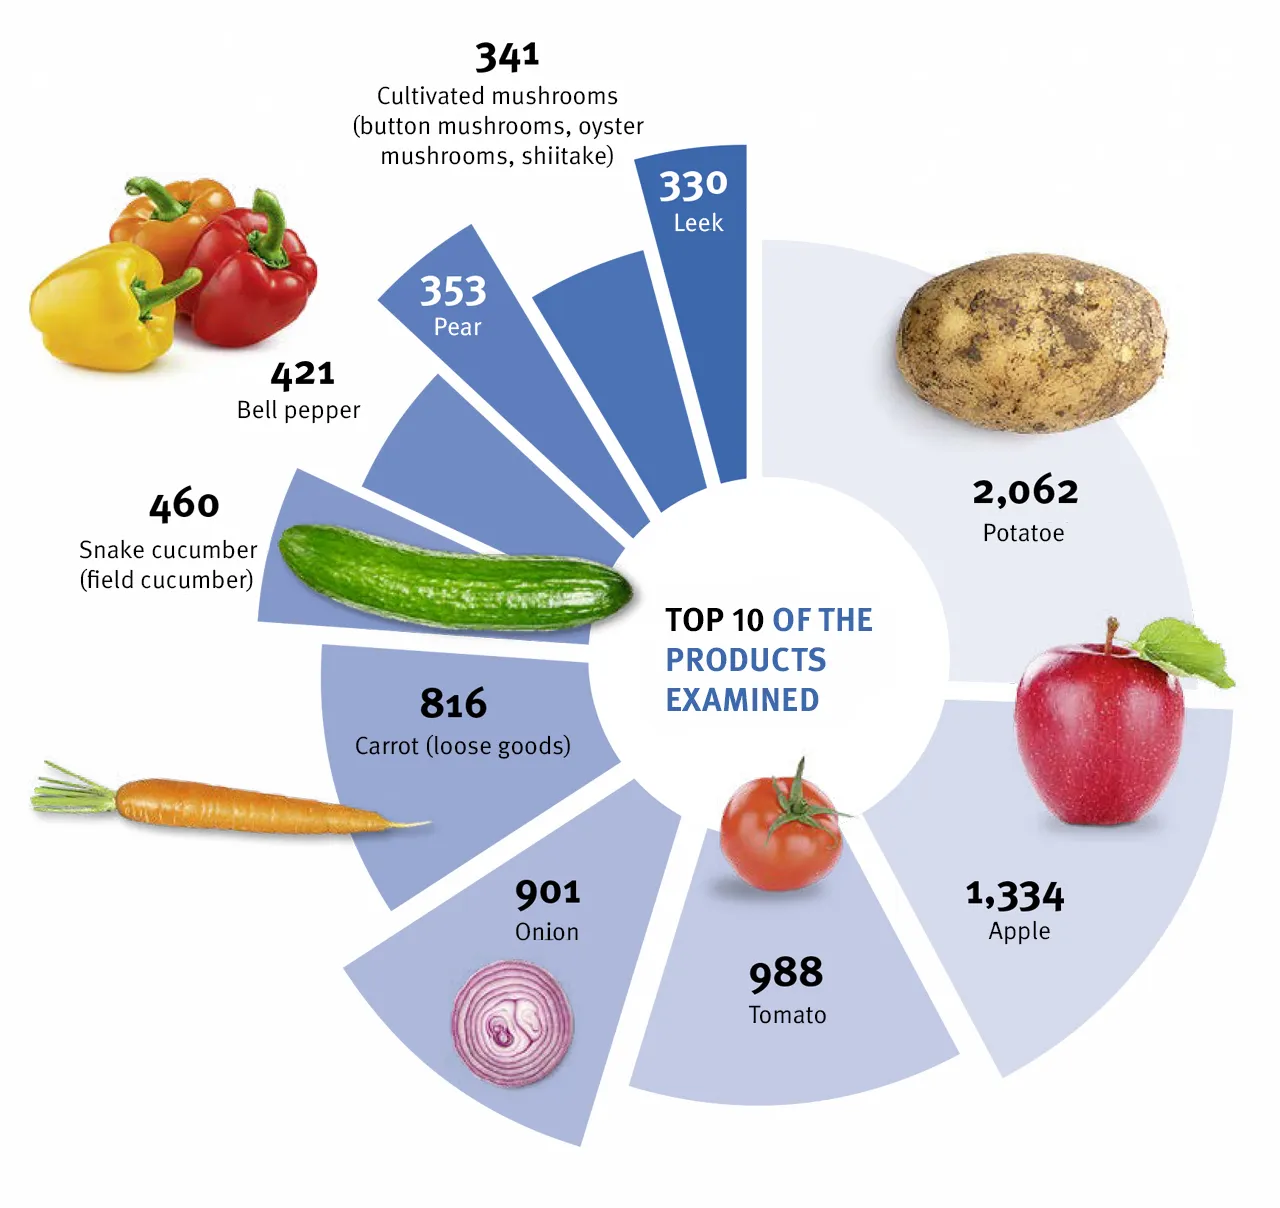
Top 10 - Examined products
A total of 15,356 fruit and vegetable samples were analysed for the current evaluation of the QS residue monitoring programme (evaluation period from 1 October 2024 to 30 September 2025). The most common were potatoes (2,062 samples), apples (1,334 samples), and tomatoes (988 samples). The current evaluation chart shows the top 10 in the residue monitoring.
Click on the graphic to enlarge
Apples - Number of samples analysed (2009 to 2025)
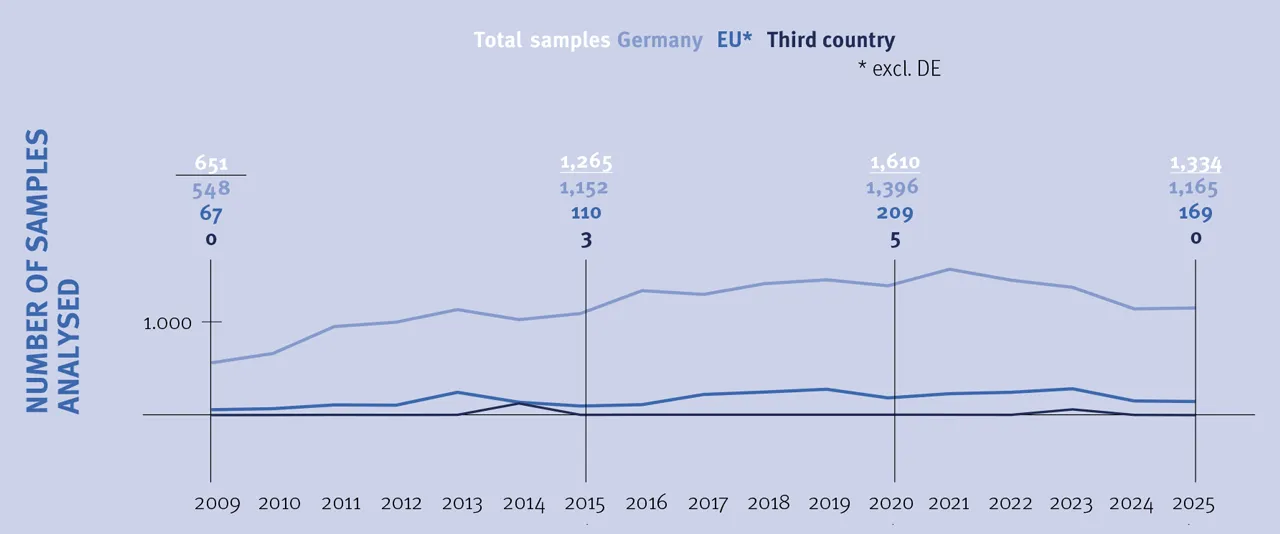
Click on the graphic to enlarge
Between 2009 and 2025, QS analysed 23,175 apple samples as part of its residue monitoring program—19,787 from Germany, 3,126 from the EU, and 262 from third countries. When the collection of data began in the residue database in 2009, 651 apple samples were recorded. In 2021, the largest number of apple samples were examined, with 1,816 samples.
Apples – proportion of samples exceeding the maximum residue limit (2009 to 2025)
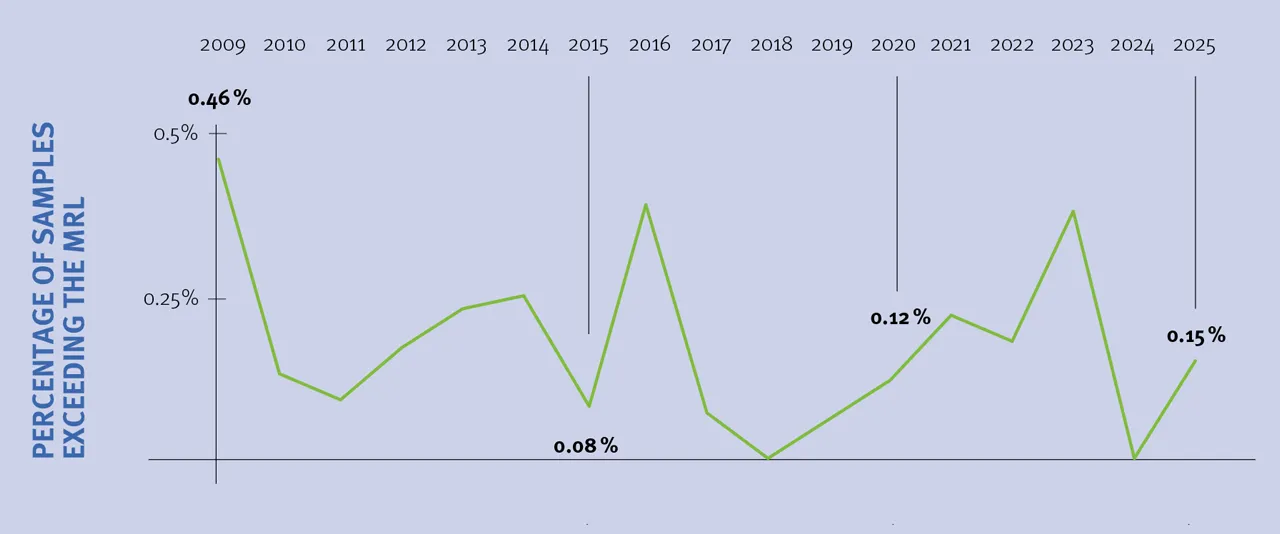
Click on the graphic to enlarge
The average MRL exceedance in the period between 2009 and 2025 is a low 0.18 percent. This is clear evidence of the responsible use of plant protection products by producers in the QS scheme. While 0.46 percent of the apple samples analysed in 2009 exceeded the legal maximum residue levels (MRLs), lower exceedance rates were recorded in subsequent years. In 2018 and 2024, none of the apple samples analysed exceeded the MRLs. In 2016 and 2023, 0.39 and 0.38 percent, respectively, exceeded the legal maximum residue levels. The reasons for this were drift from neighboring crops and slower degradation rates of the PPP active substances used.
Apples: Number of samples and main countries of origin of the samples examined
- Number of samples analysed (total): 1,334
- Number/proportion of samples from Germany: 1,165 samples / 87.33%
- Number/proportion of samples from the EU (excluding Germany): 169 samples / 12.67%
- Main countries of origin in the EU (excluding Germany):
- Austria (116 samples / 8.7% of samples)
- Netherlands (31 samples / 2.32% of samples)
- Belgium (13 samples / 0.97%)
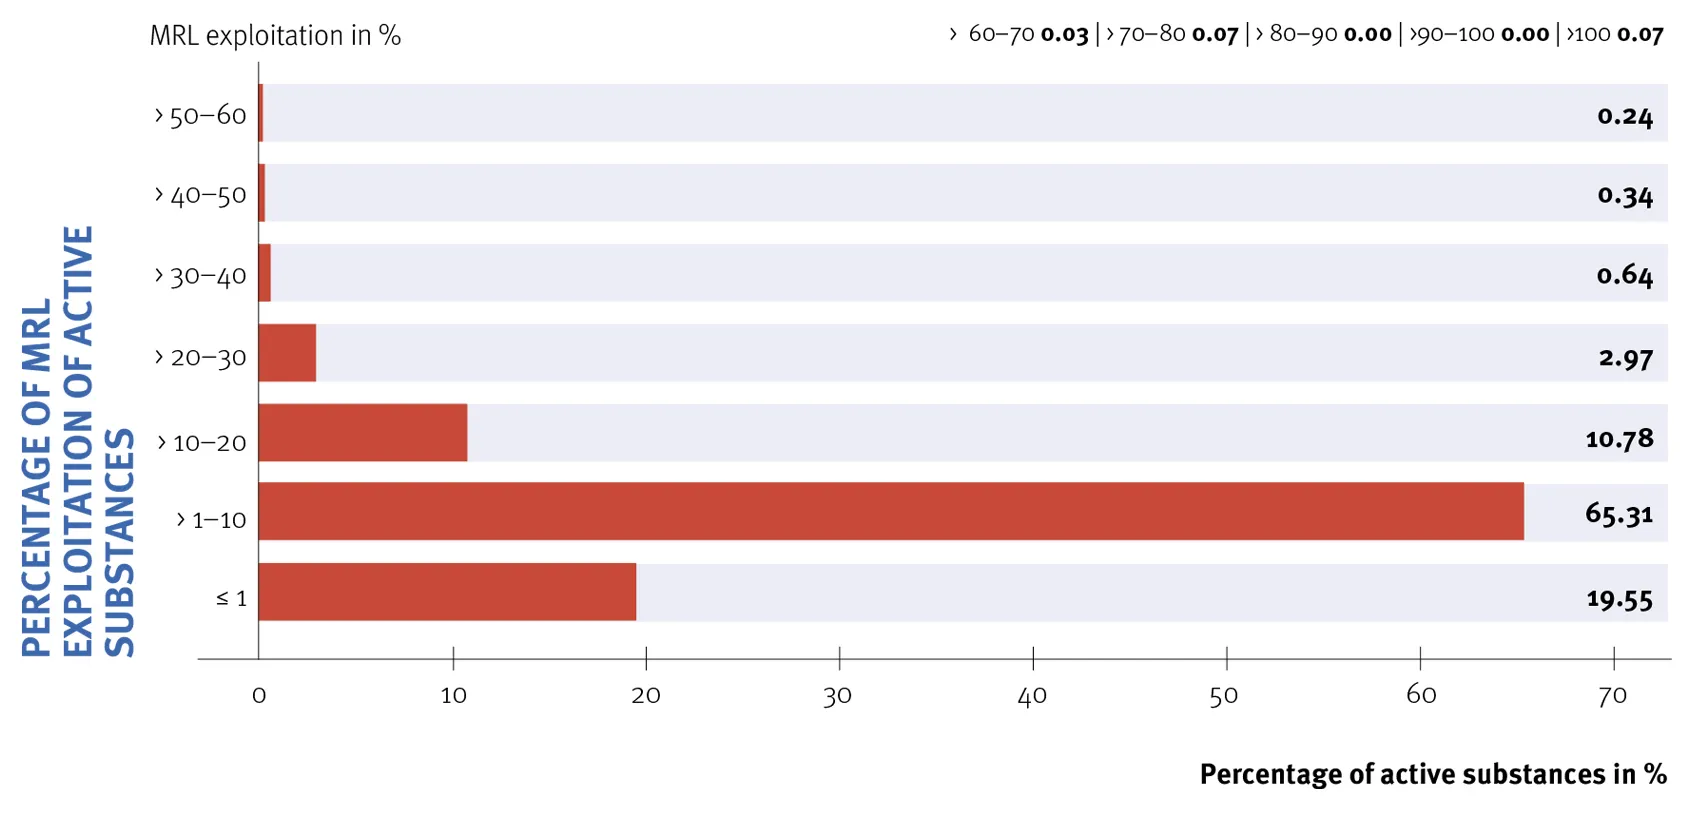
Apples - MRL utilization of active substances
Click on the graphic to enlarge
- Number of samples without MRL exceedance: 1,332
- Number of samples with MRL exceedance: 2 (active substances: prosulfocarb and propamocarb)
- Exceedance rate (total): 0.15%
- The utilization of maximum residue levels was 95.6% of the active substances found at a maximum of 20% (see chart).
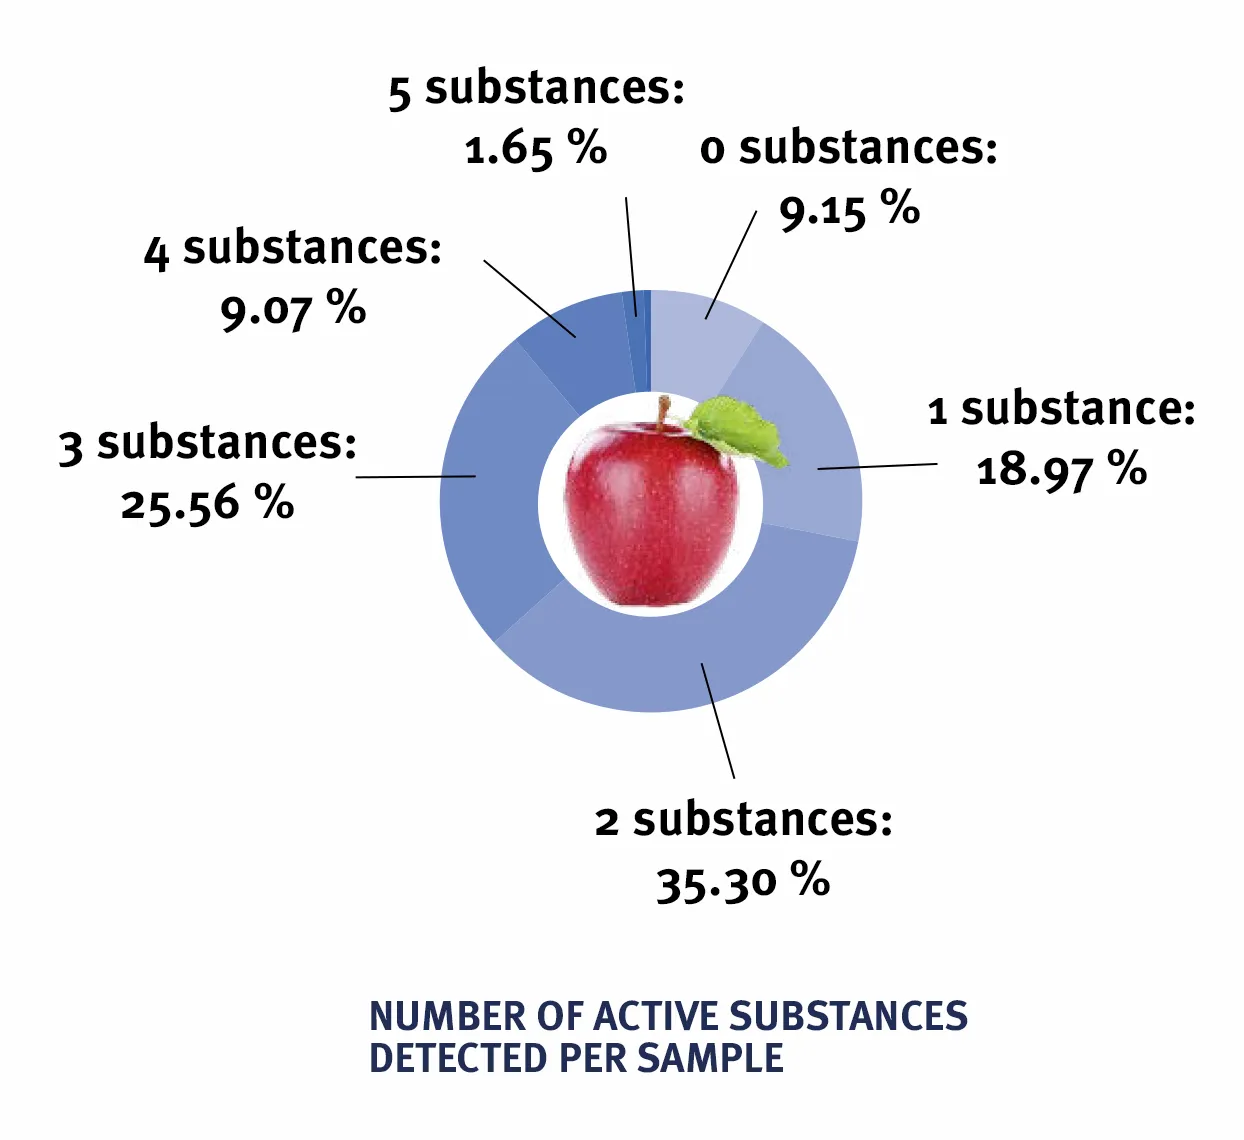
Apples: Percentage of detected active substances per sample
Click on the graphic to enlarge
- Samples without active substance detection: 9.15% of samples
- Samples with active substance detection: 90.85% of samples
- Samples with multiple residues: 71.88% of samples
- Samples with 1 active substance detected: 253 / 18.97% of samples
- Samples with 2 detected active substances: 471 / 35.3% of samples
- Samples with 3 detected active substances: 341 / 25.56% of samples
- Samples with 4 detected active substances: 121 / 9.07% of samples
- Samples with 5 active substances detected: 22 / 1.65% of samples
- Samples with ≥ 5 active substances detected: 4 / 0.3% of samples
Click on the graphic to enlarge
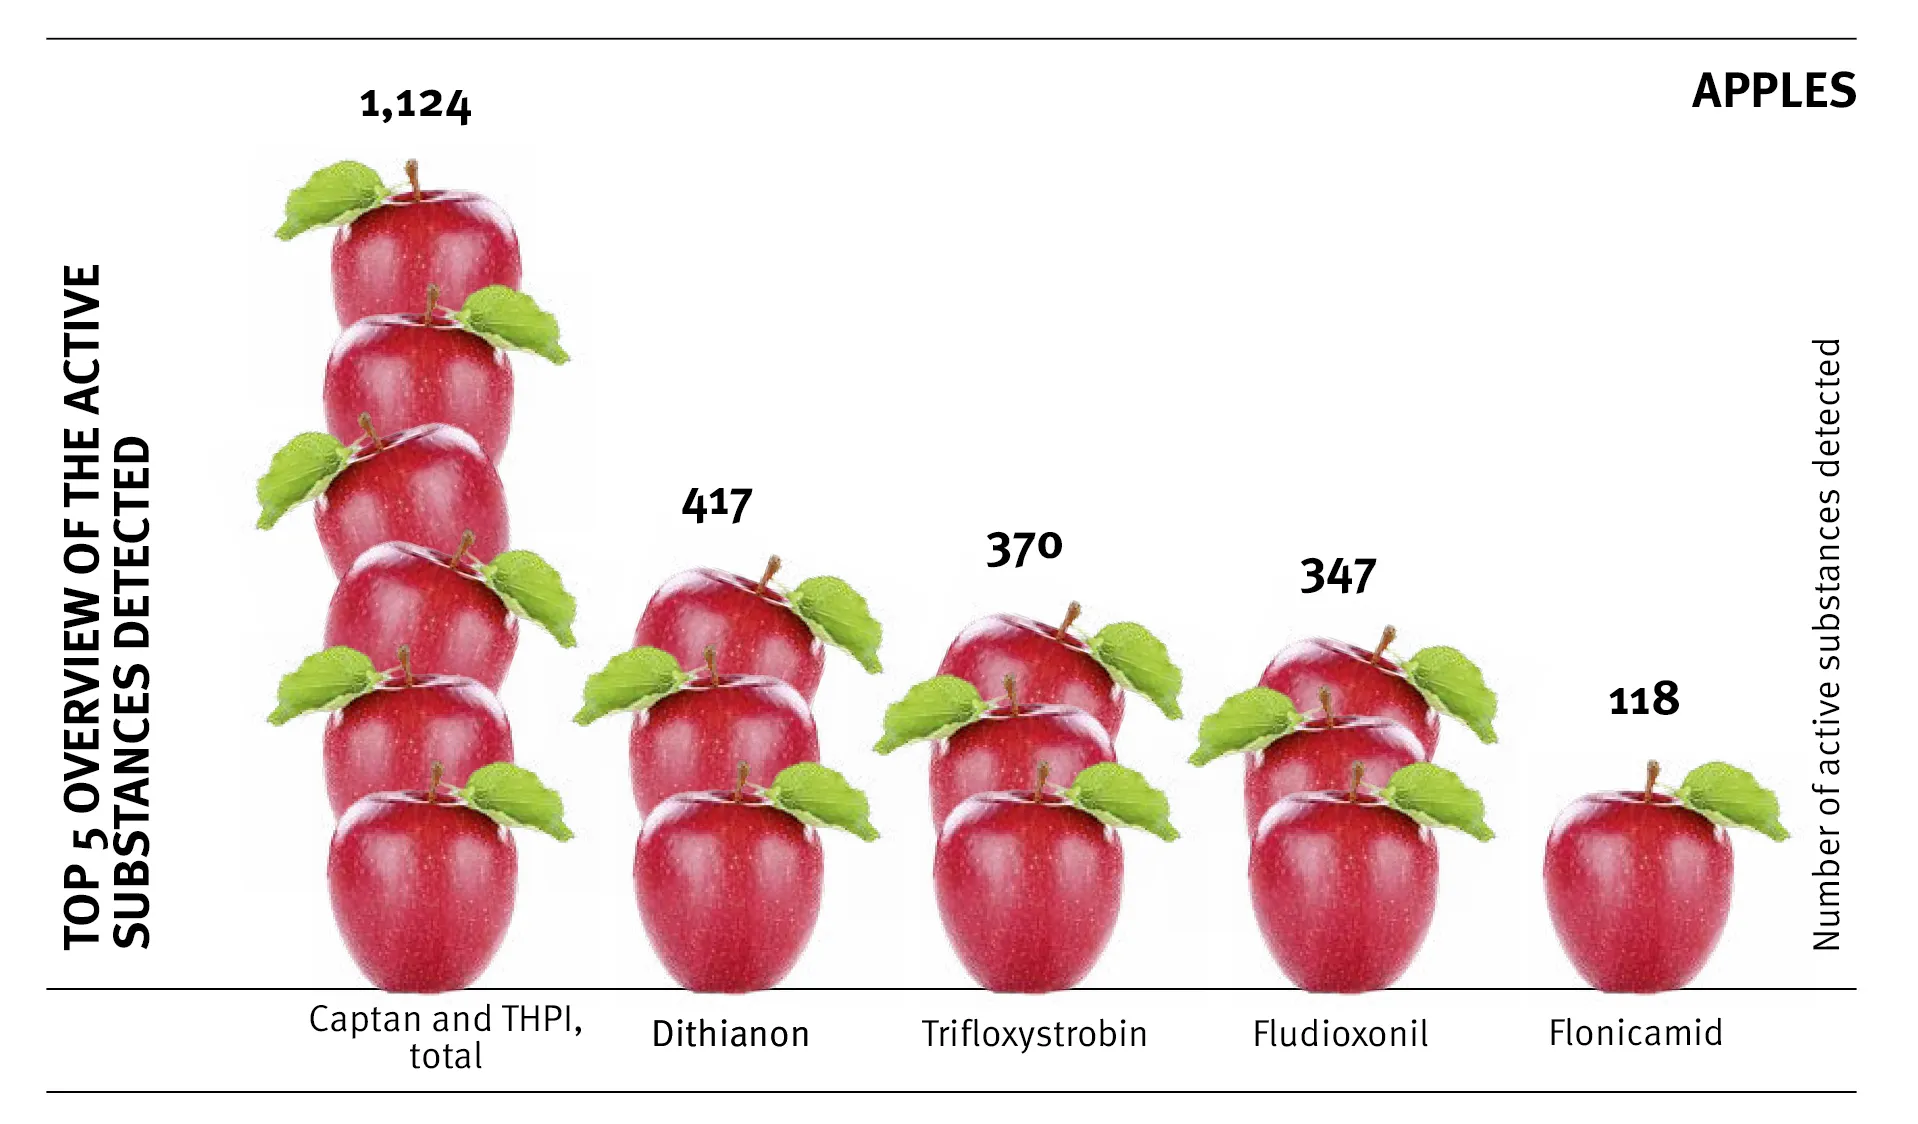
Apples: Top 5 proven active substances
1) Captan and THPI, total: 1,124 detections
2) Dithianon: 417 detections
3) Trifloxystrobin: 370 detections
4) Fludioxonil: 347 detections
5) Flonicamid: 118 detections
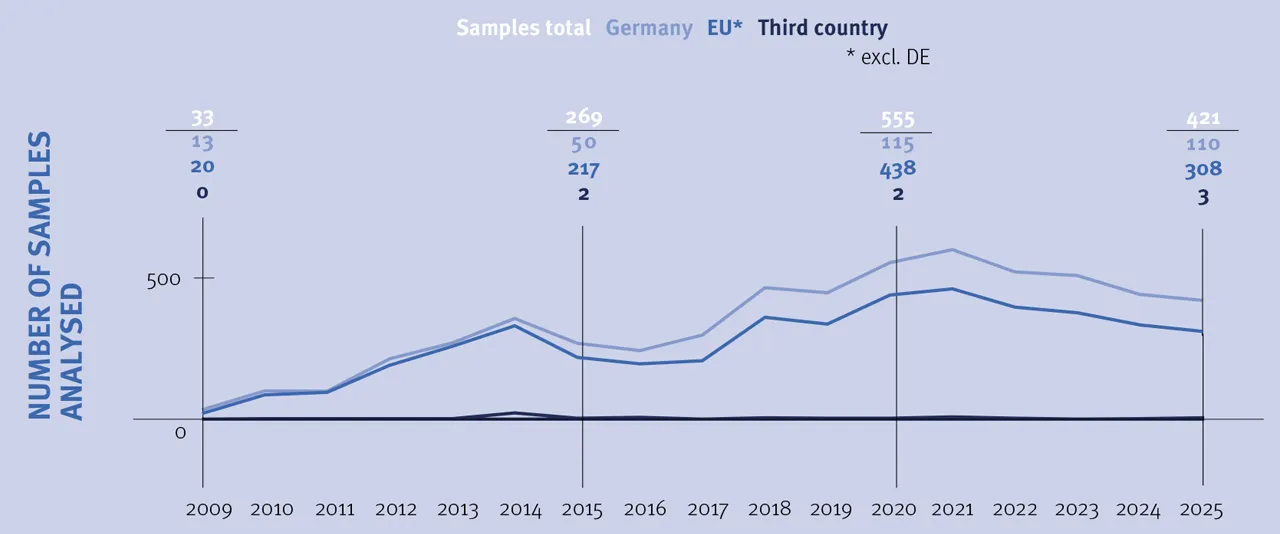
Bell peppers – Number of samples tested (2009 to 2025)
Click on the graphic to enlarge
In total, QS has analysed 5,847 bell pepper samples for residue monitoring over the past 16 years. Of these, 4,580 samples were EU goods, while 1,225 samples from Germany and 42 samples from third countries were also included in the study. While the number of samples examined in the QS residue database was still 33 at the beginning of the collection in 2009, this number increased continuously until 2021 (601 bell pepper samples recorded and examined), with a few exceptions. Since 2022, the number of samples has declined slightly and currently stands at 421 samples in the latest evaluation.
Bell peppers – proportion of samples exceeding the MRL (2009 to 2025)
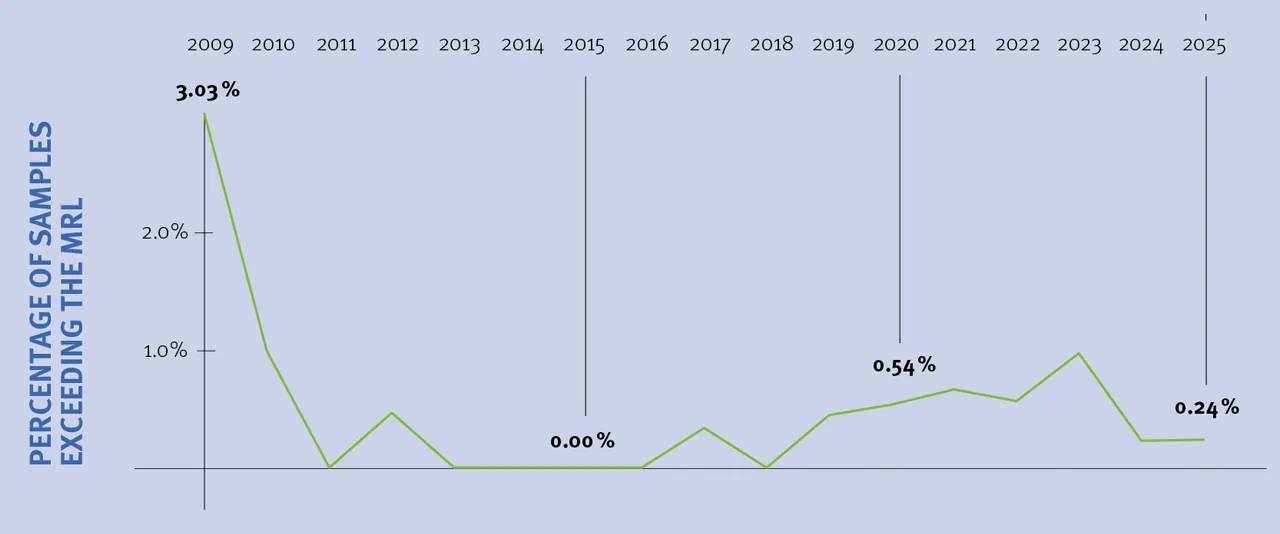
Click on the graphic to enlarge
The trend in the proportion of samples exceeding the MRL is positive: while this figure was still 3.03 percent in 2009, it averaged 0.3425 percent between 2010 and 2023. In 2011, 2013, 2014, 2015, 2016, and 2018, not a single bell pepper sample tested exceeded the MRL.
Bell peppers: Number of samples and main countries of origin of the samples analysed
- Number of samples analysed (total): 421
- Number/proportion of samples from Germany: 110 samples / 26.13%
- Number/proportion of samples from the EU (excluding Germany): 308 samples / 73.16%
- Main countries of origin in the EU (excluding Germany):
- Netherlands (272 samples / 64.4% of samples)
- Belgium (30 samples / 7.13% of samples)
- Spain (6 samples / 1.43% of samples)
Bell peppers: MRL utilization of active substances
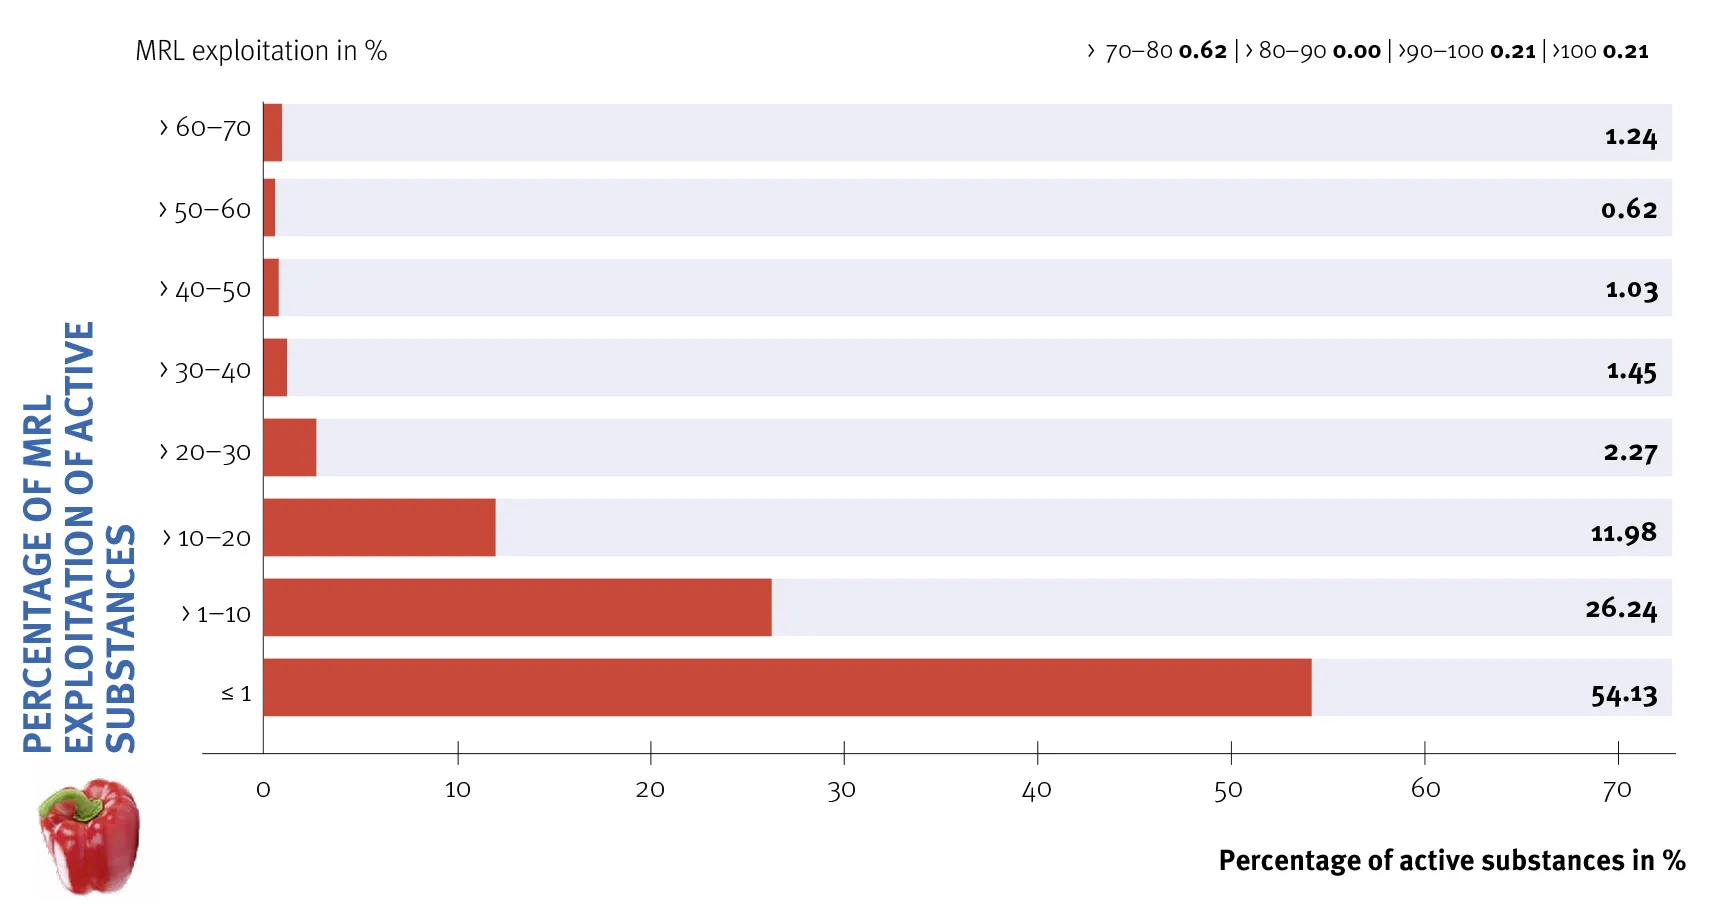
Click on the graphic to enlarge
- Number of samples without MRL exceedance: 420
- Number of samples with MRL exceedance: 1 (active substance: acequinocyl)
- Exceedance rate (total): 0.24%
- The utilization of maximum residue levels was less than 20% for 92.35% of the active substances found (see chart).
Bell peppers: Percentage of detected active substances per sample
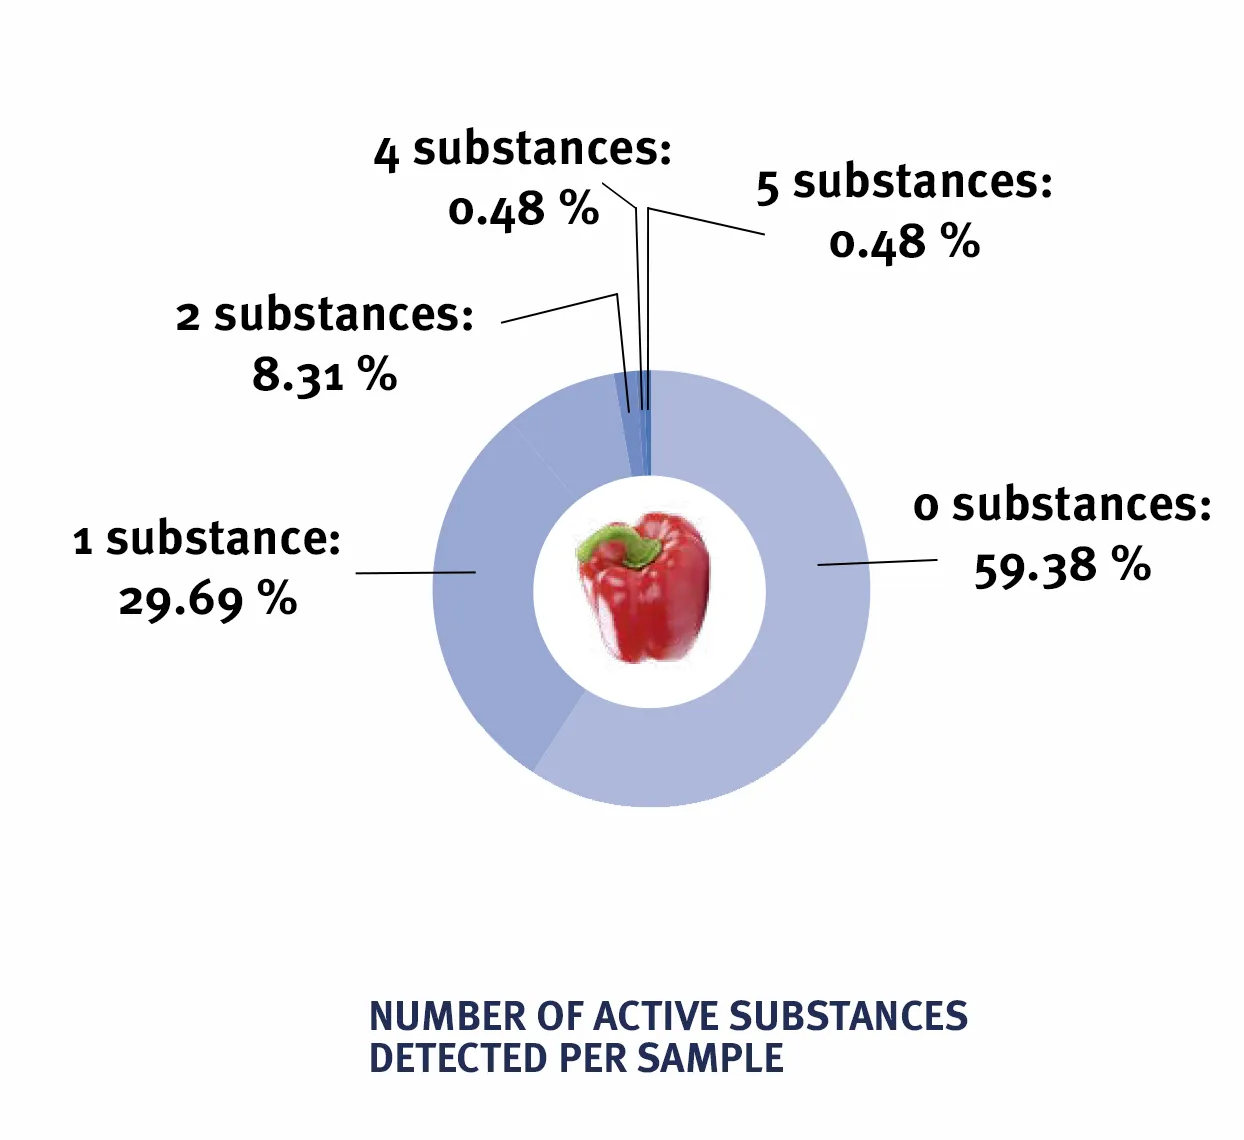
Click on the graphic to enlarge
- Samples without active substance detection: 59.38% of samples
- Samples with active substance detection: 40.62% of samples
- Samples with multiple residues: 10.93% of samples
- Samples with 1 detected active substance: 125 / 29.69% of samples
- Samples with 2 active substances detected: 35 / 8.31% of samples
- Samples with 3 active substances detected: 7 / 1.66% of samples
- Samples with 4 active substances detected: 2 / 0.48% of samples
- Samples with 5 active substances detected: 2 / 0.48% of samples
Click on the graphic to enlarge
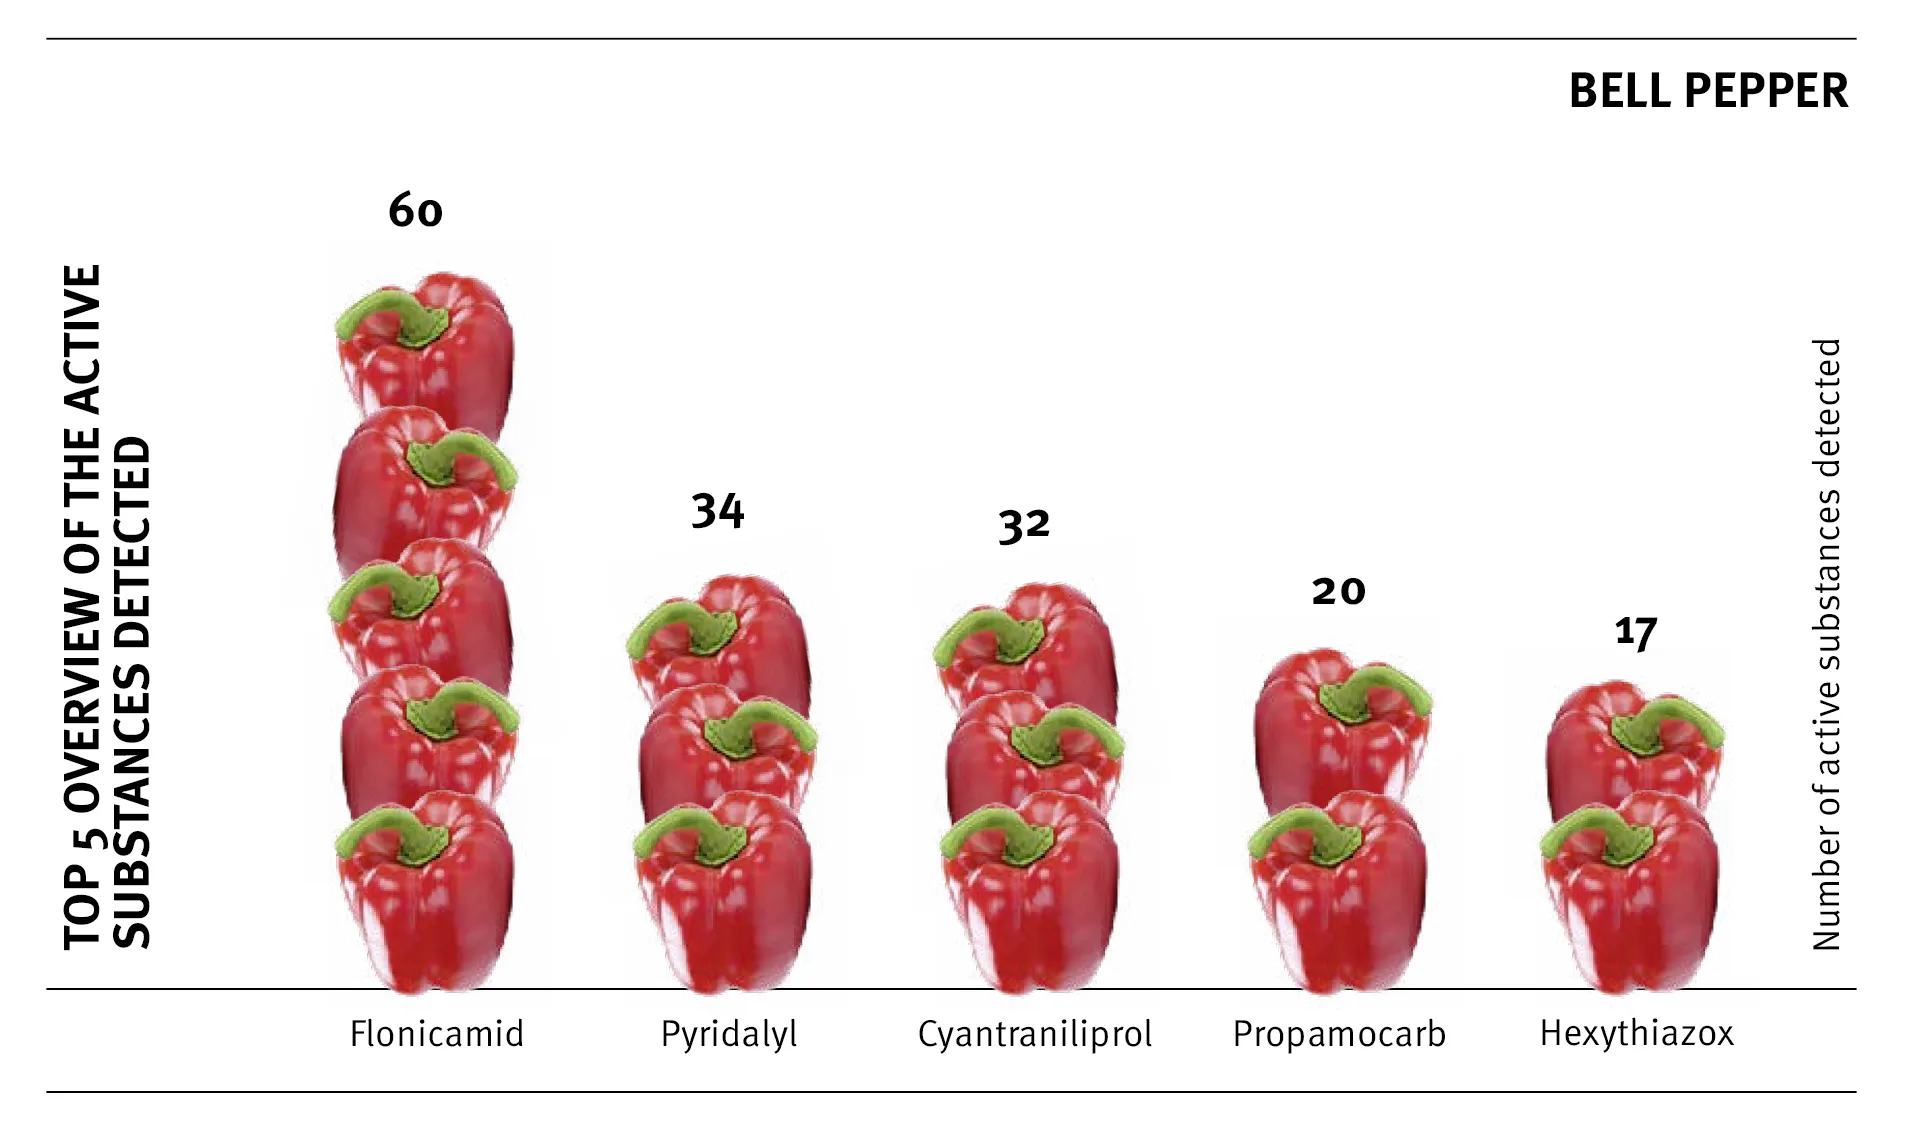
Bell peppers: Top 5 detected active substances
1) Flonicamid: 60 detections
2) Pyridalyl: 34 detections
3) Cyantraniliprole: 32 detections
4) Propamocarb: 20 detections
5) Hexythiazox: 17 detections
Potatoes - Number of samples analysed (2009 to 2025)
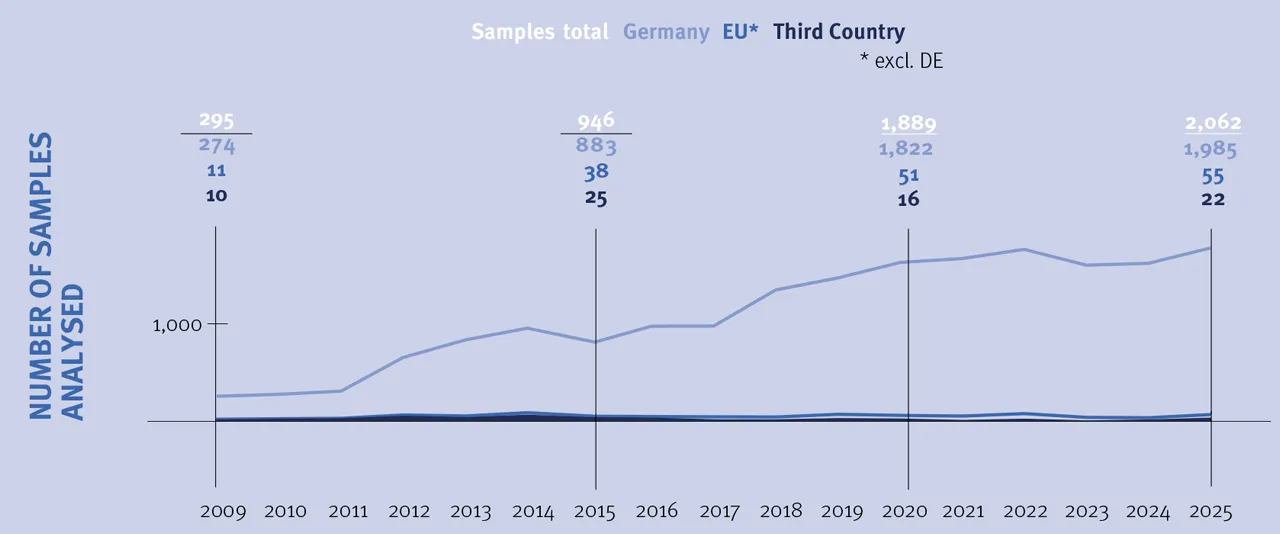
Click on the graphic to enlarge
Between 2009 and 2025, QS analysed a total of 21,941 potato samples for residue monitoring. 20,963 samples were from potato producers in Germany, while QS also evaluated 673 samples from the EU and 305 samples from third countries during this period. Over the last 16 years, the number of potato samples analysed has risen steadily, with the exception of 2015, 2023 and 2024: in 2009, only 295 samples were included in the evaluation, while in the current evaluation year 2025, a maximum level of 2,062 samples was recorded.
Potatoes – proportion of samples exceeding the maximum residue limit (2009 to 2025)
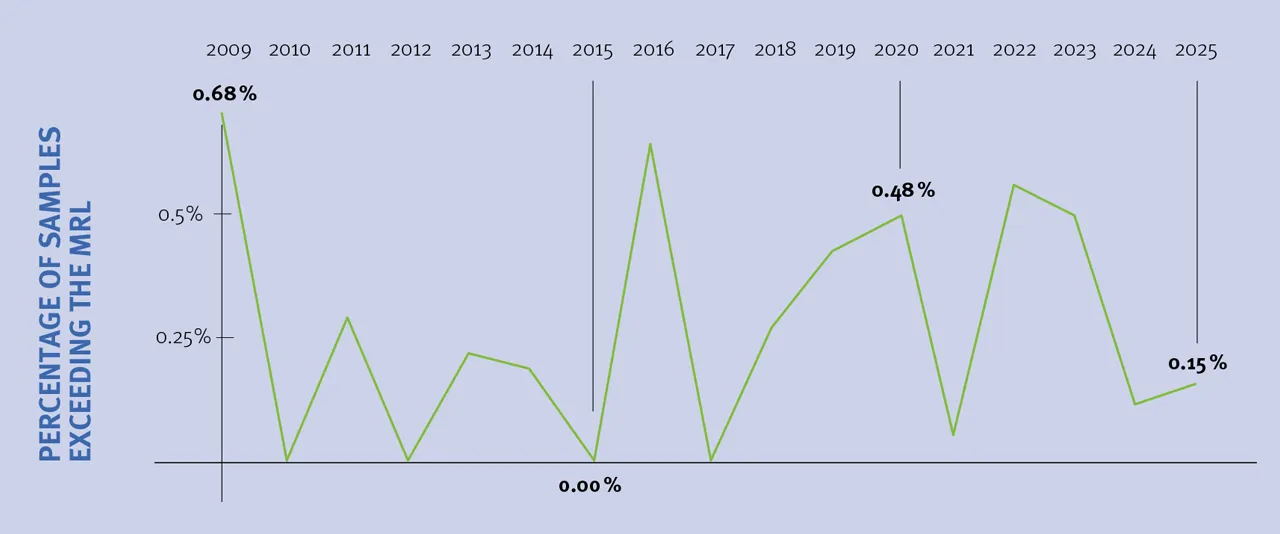
Click on the graphic to enlarge
The overall evaluation of data from QS residue monitoring shows that QS producers consistently comply with the legally prescribed maximum residue levels (MRLs) when using plant protection products in potato cultivation. In all years evaluated, the rate of MRL exceedances was less than one percent, with an average of 0.26 percent for the entire period.
Potatoes: Number of samples and main countries of origin of the samples analysed
- Number of samples analysed (total): 2,062
- Number/proportion of samples from Germany: 1,985 samples / 96.27%
- Number/proportion of samples from the EU (excluding Germany): 55 samples / 2.67%
- Main countries of origin from the EU (excluding Germany):
- Belgium (25 samples / 1.21% of samples)
- Netherlands (14 samples / 0.68% of samples)
- Spain (11 samples / 0.53% of samples)
Potatoes: MRL utilization of active substances
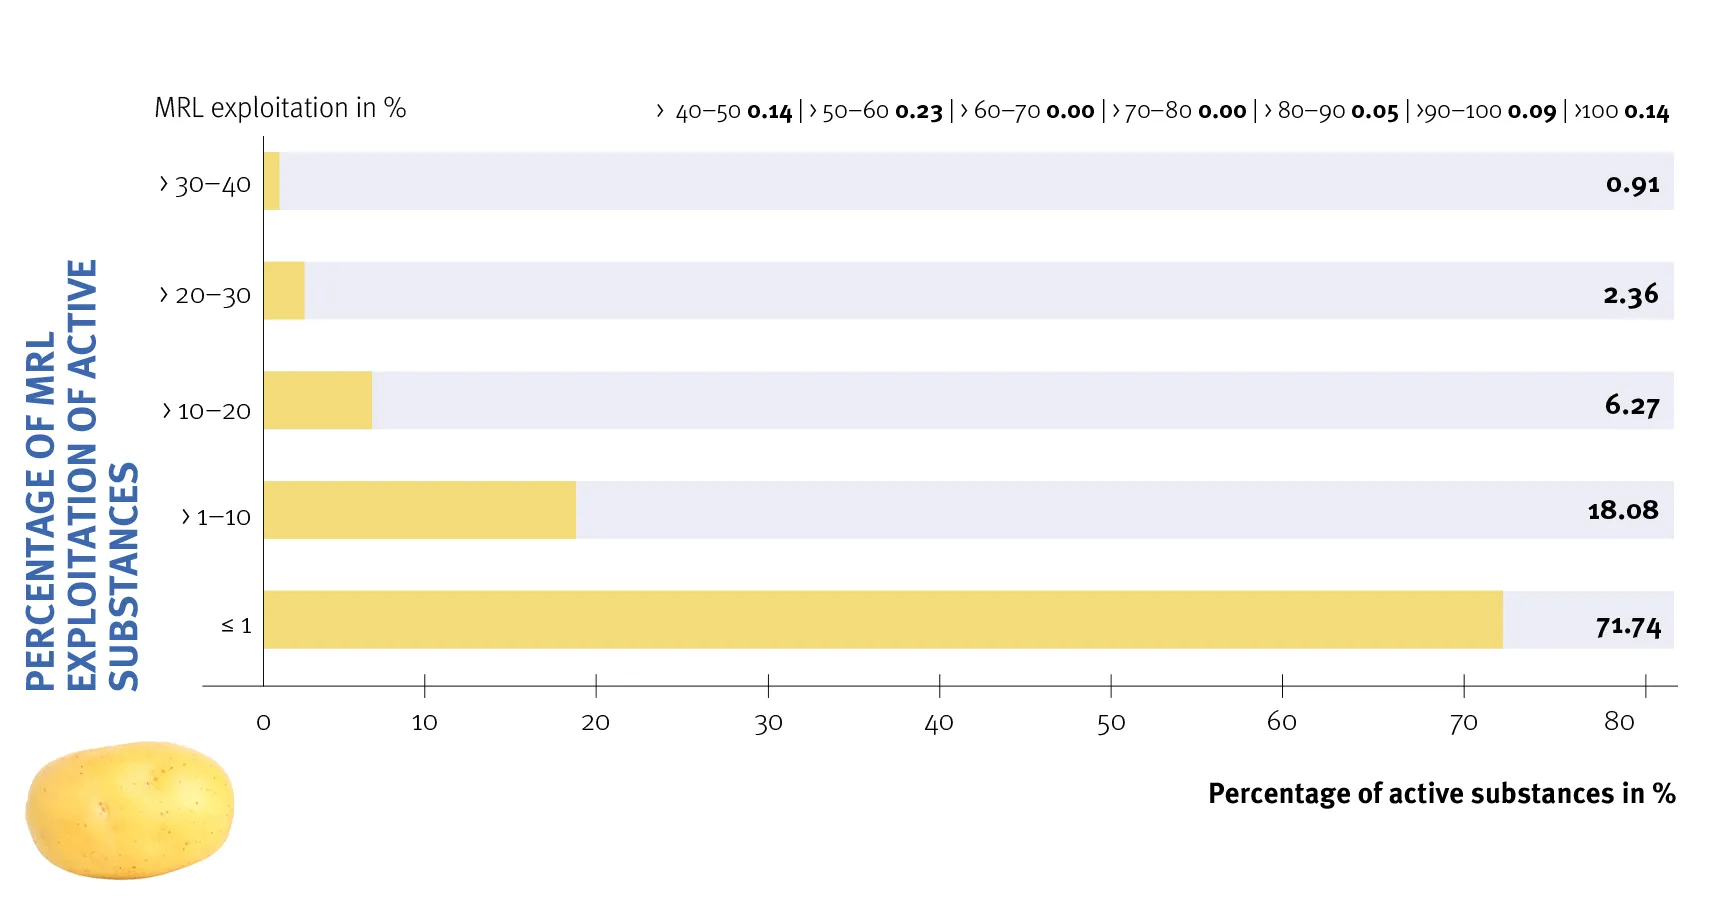
Click on the graphic to enlarge
- Number of samples without MRL exceedances: 2,059
- Number of samples with MRL exceedances: 3 (active substances: flutolanil, trinexapac, imidacloprid)
- Exceedance rate (total): 0.15%
- The utilization of maximum residue levels was less than 20% for 96.09% of the active substances found (see chart).
Potatoes: Percentage of detected active substances per sample
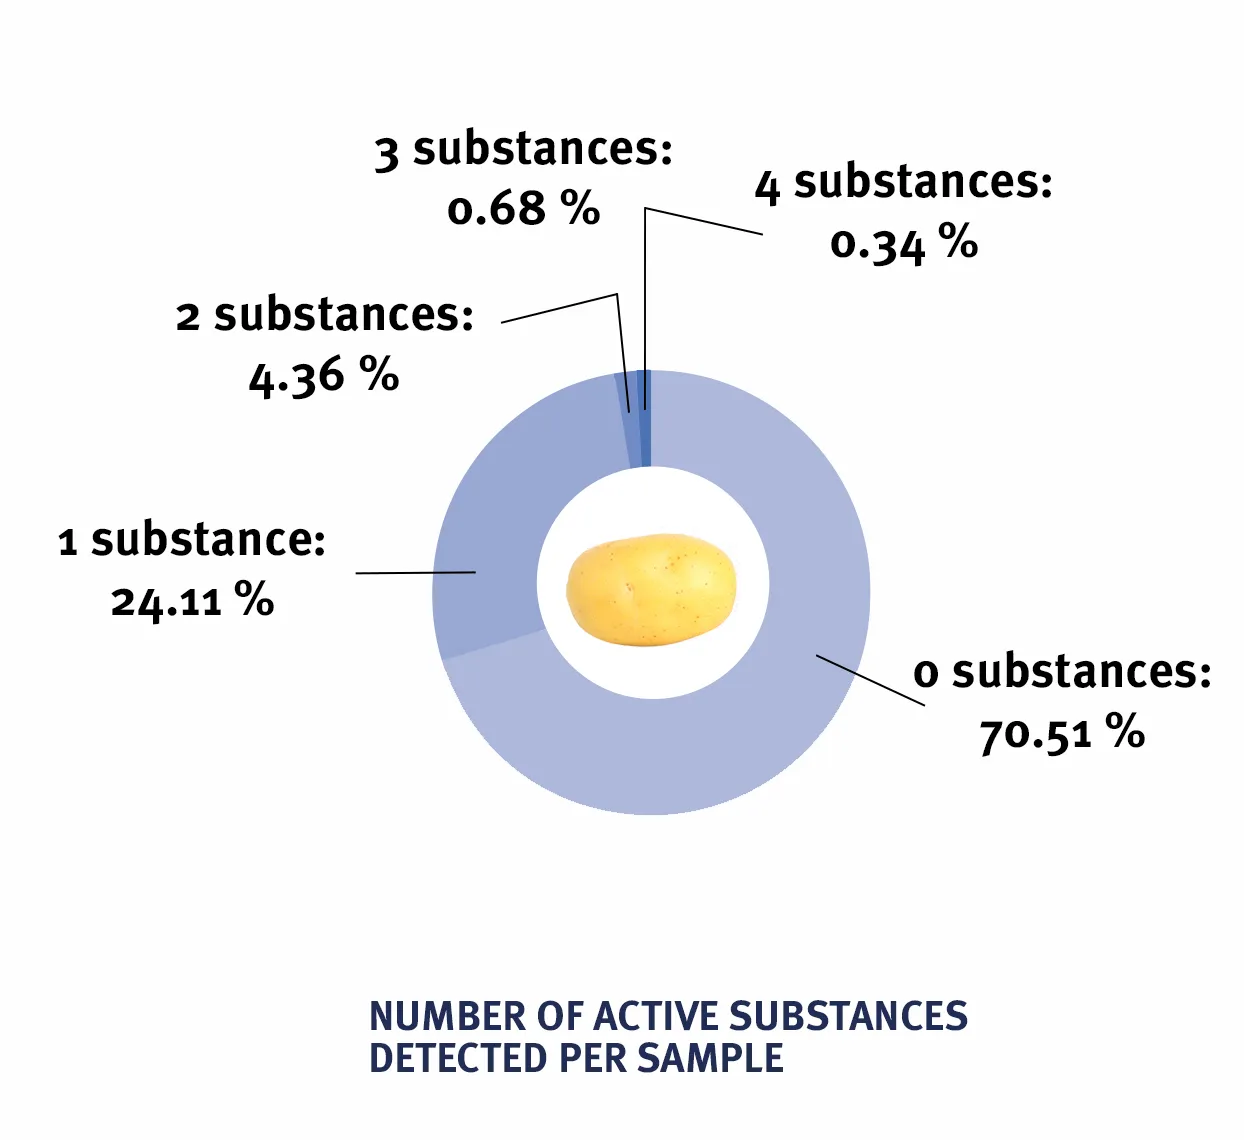
Click on the graphic to enlarge
- Samples without active substance detection: 70.51% of samples
- Samples with active substance detection: 29.49% of samples
- Samples with multiple residues: 5.38% of samples
- Samples with 1 detected active substance: 497 / 24.11% of samples
- Samples with 2 active substances detected: 90 / 4.36% of samples
- Samples with 3 active substances detected: 14 / 0.68% of samples
- Samples with 4 active substances detected: 7 / 0.34% of samples
Click on the graphic to enlarge
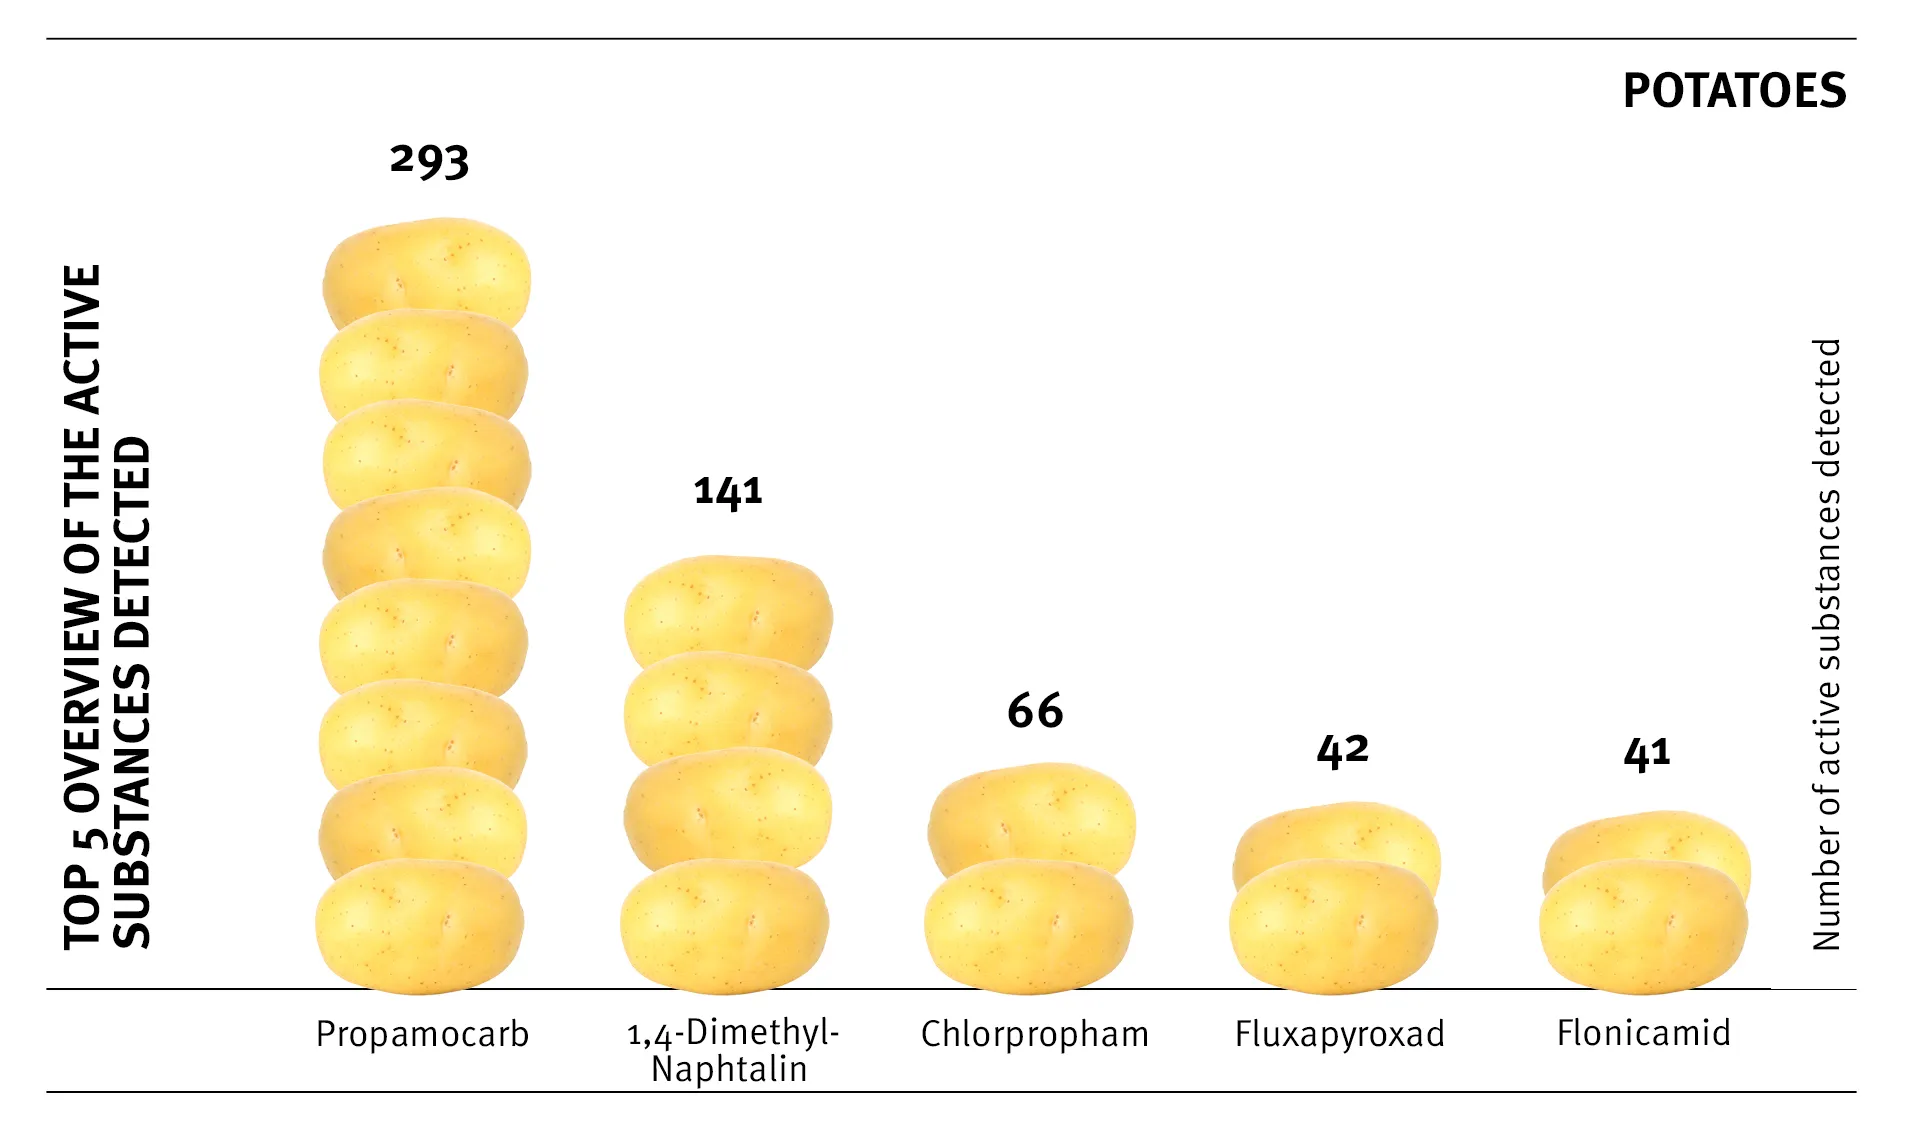
Potatoes: Top 5 active substances detected
1) Propamocarb: 293 detections
2) 1,4-Dimethylnaphthalene: 141 detections
3) Chlorpropham: 66 detections
4) Fluxapyroxad: 42 detections
5) Flonicamid: 41 detections